

Last week, I published a terrifying AI-driven flood forecast for the Chiriquí Viejo River. But it turns out the artificial intelligence was operating on “garbage” data. After returning to the river, gathering more information and better measurements, and retraining the model, I found a much kinder reality. The new data offers reassurance for seasonal storms, but it also confirms that a monster on the scale of Hurricane Eta will still bring absolute peril. (See article in Spanish here).
I focused on an 800-meter stretch of the river upstream from the La Florentina bridge in Paso Ancho. This area is critical because of its vulnerability to catastrophic flooding, severe bank erosion and sudden river channel shifts.
In November 2020, torrential rain from Hurricane Eta triggered flooding along the river and landslides that caused at least five deaths in Paso Ancho.
In October 2022, Hurricane Julia brought torrential rain to Tierras Altas. The Chiriquí Viejo River radically changed its course, destroying the main asphalt road leading to La Florentina farms and leaving a house dangling on the edge of a newly formed cliff.
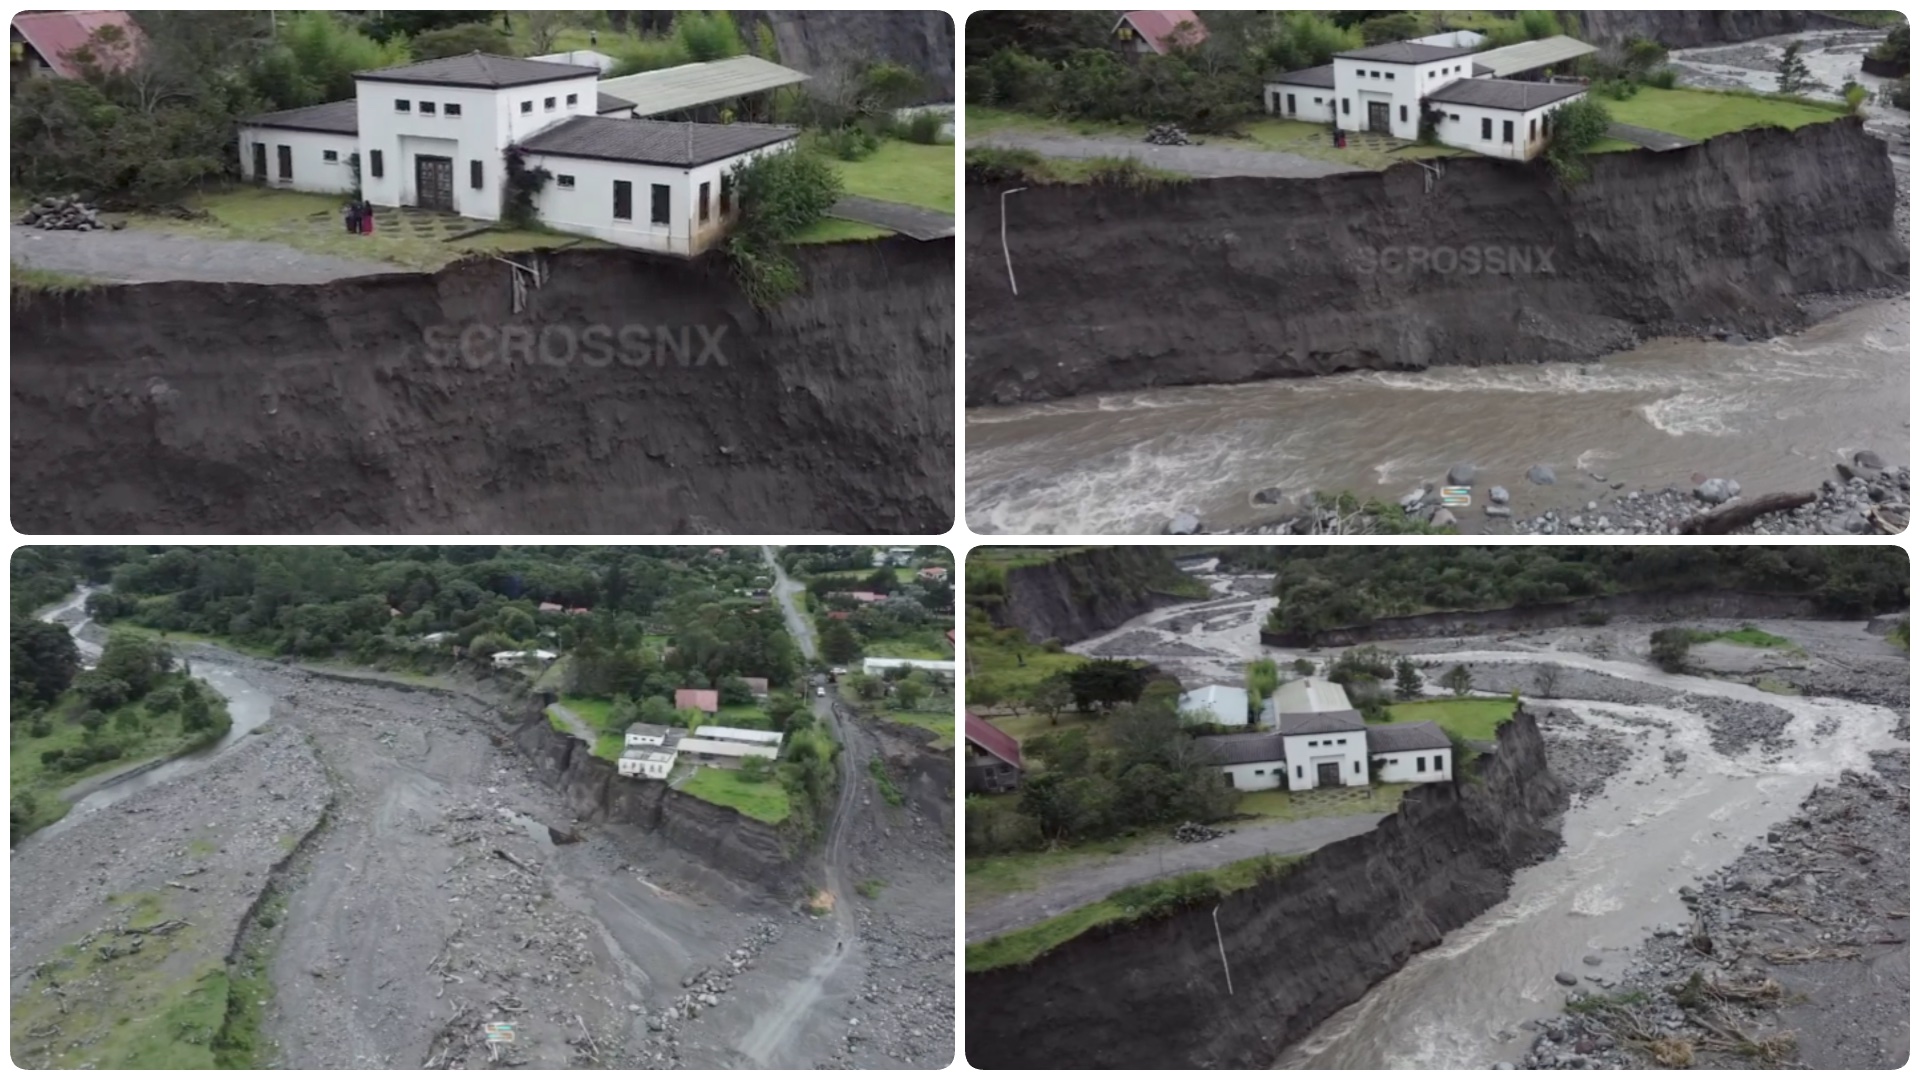
In response, the Ministry of Public Works awarded a $4,423,851.74 contract to Bagatrac, S.A., to divert the river channel away from the cliff, cloak it in 700 meters of rock- and concrete-armor, create a huge berm to protect the cliff and build a 45-meter bridge.
In connection with the project, the Ministry of Industries and Commerce gave Bagatrac authorization to remove 50,000 cubic meters of rock and gravel just upstream from the bridge. The extraction effort began where the riprap ended and extended upstream about 285 meters. Work was completed in May.
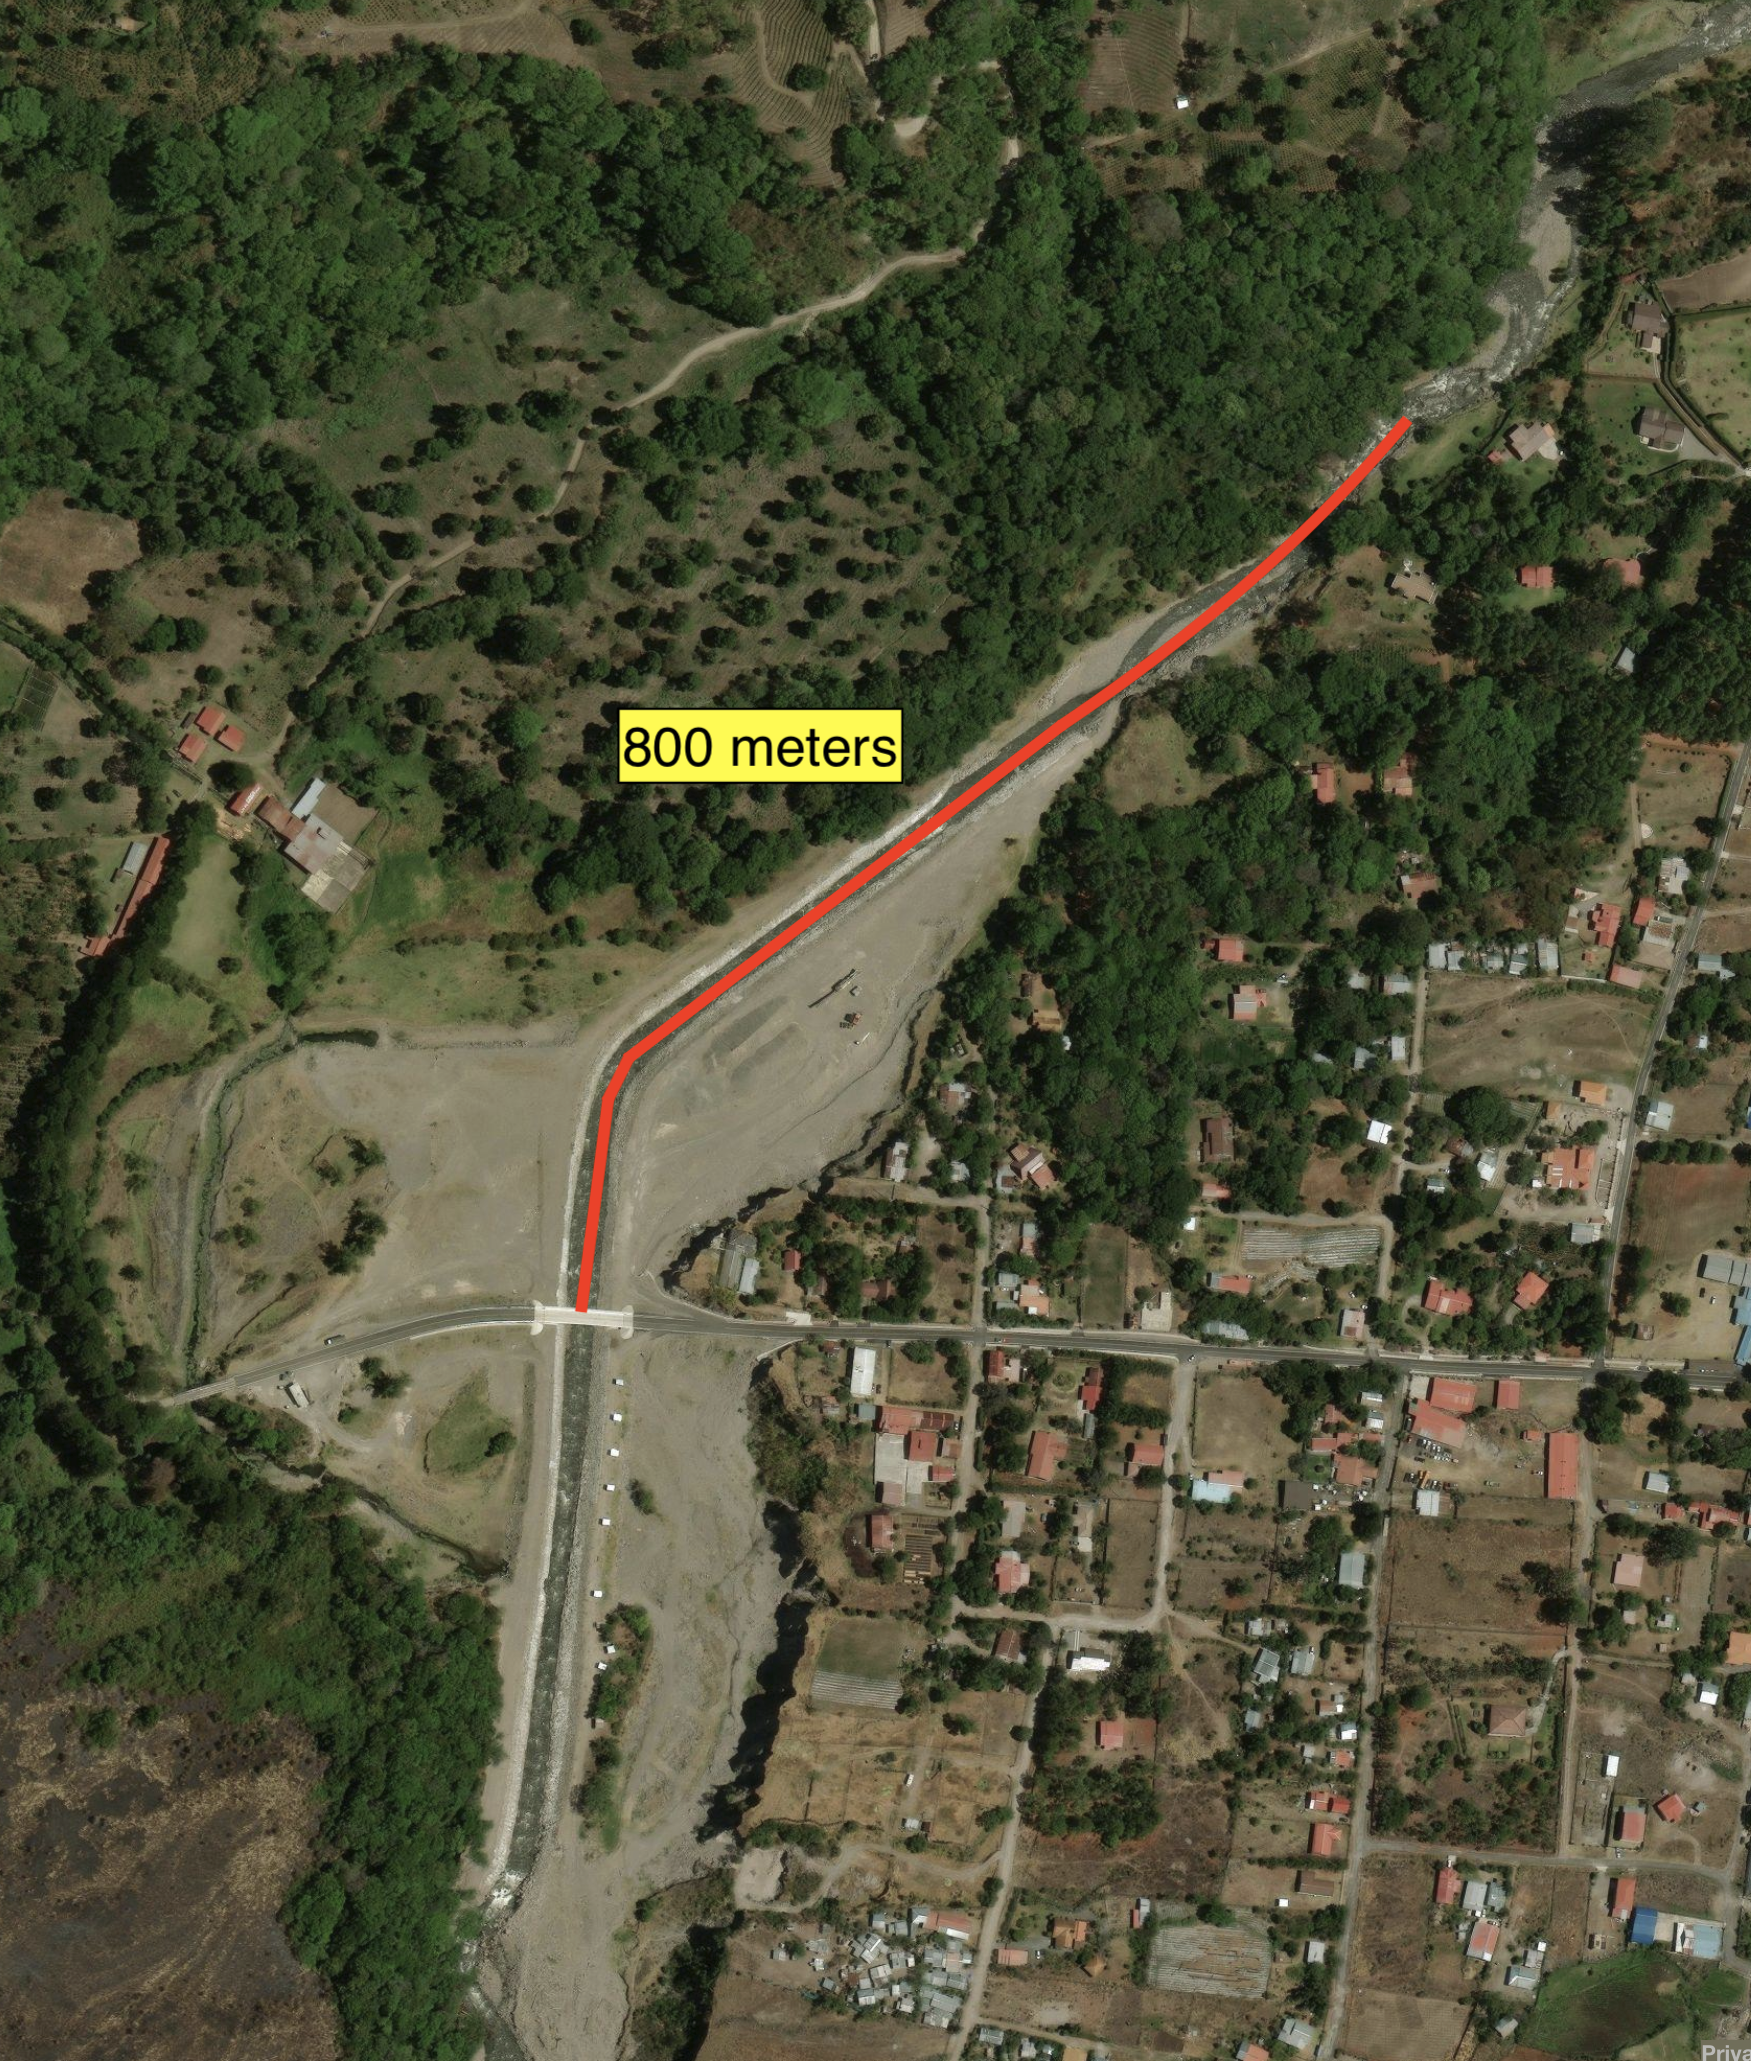
I examined an 800-meter expanse of the river, starting about 100 meters upstream from the extraction project. I divided the river into five sections, each with different characteristics. I did my best to determine: Length of each section, width of the wetted channel (where the river currently flows), width of the river banks (which can hold rising water), slope of the bank, and width of the bankful channel, which includes banks on each side.
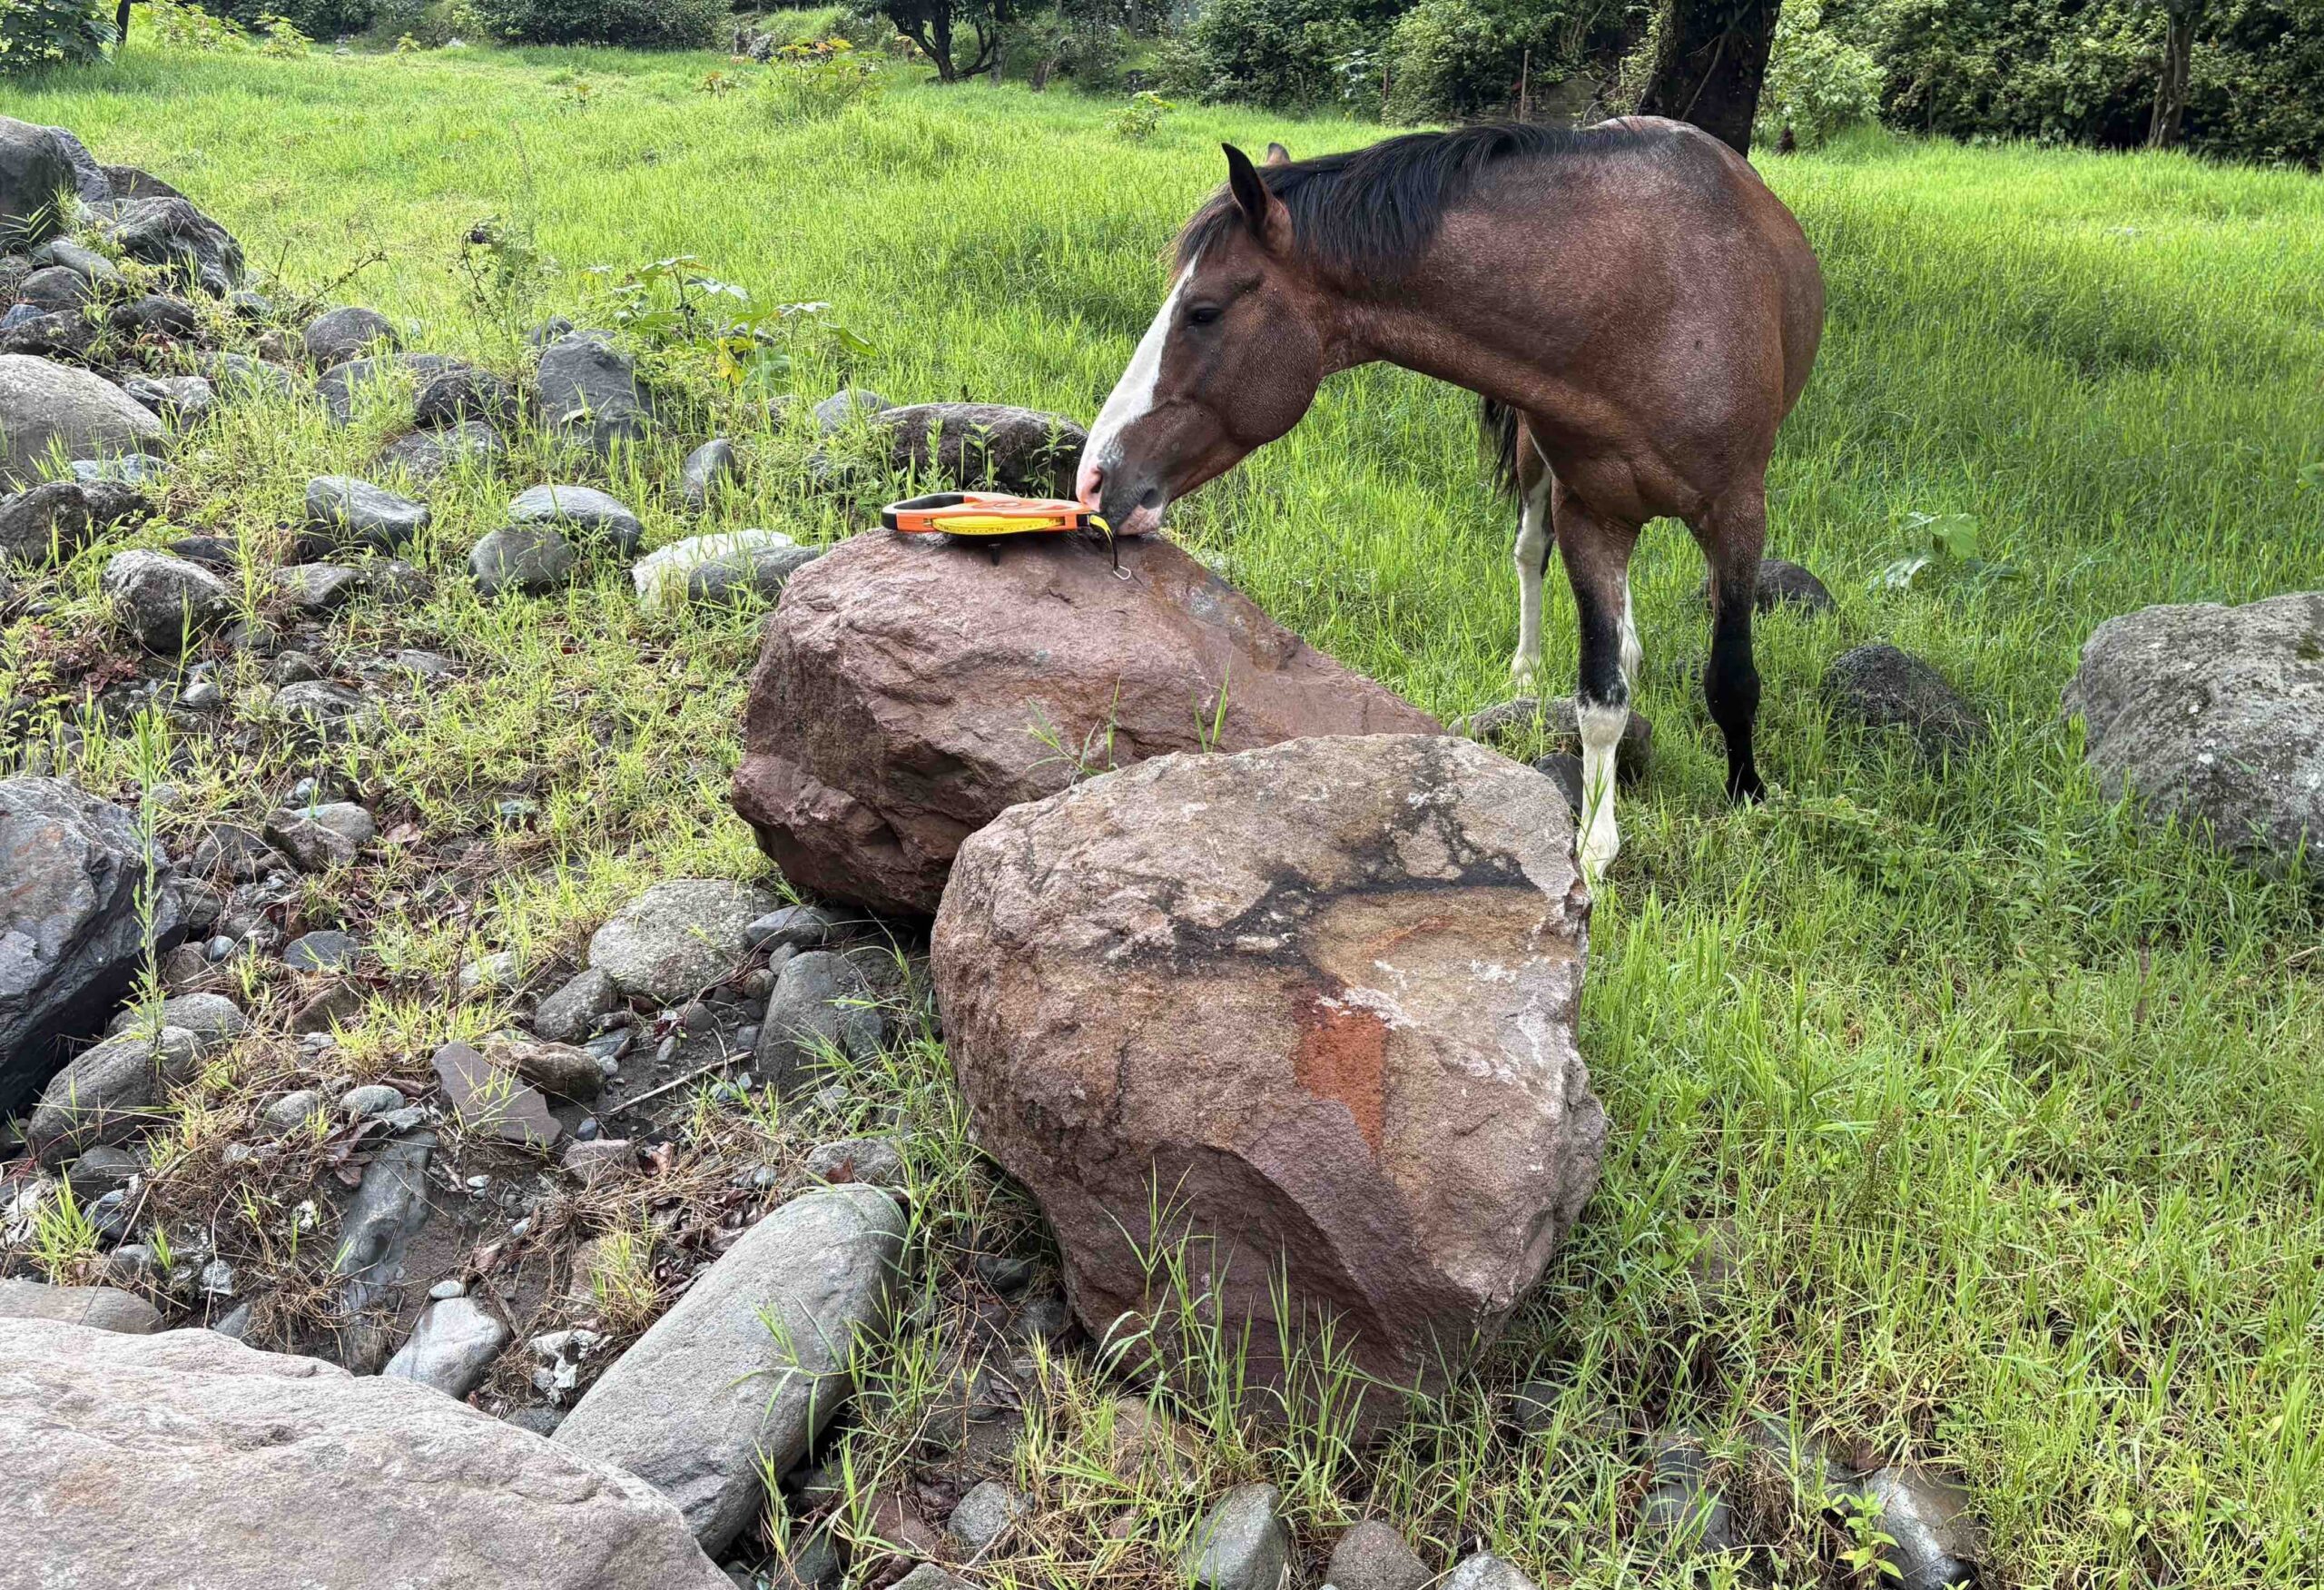
I experimented with different measuring tools. I tried using a Harden 60-meter laser distance meter, but it was too hard to see the laser in daylight. I also tried using iPhone’s measuring tool. It was great for up-close measurements, but didn’t work for long distances.
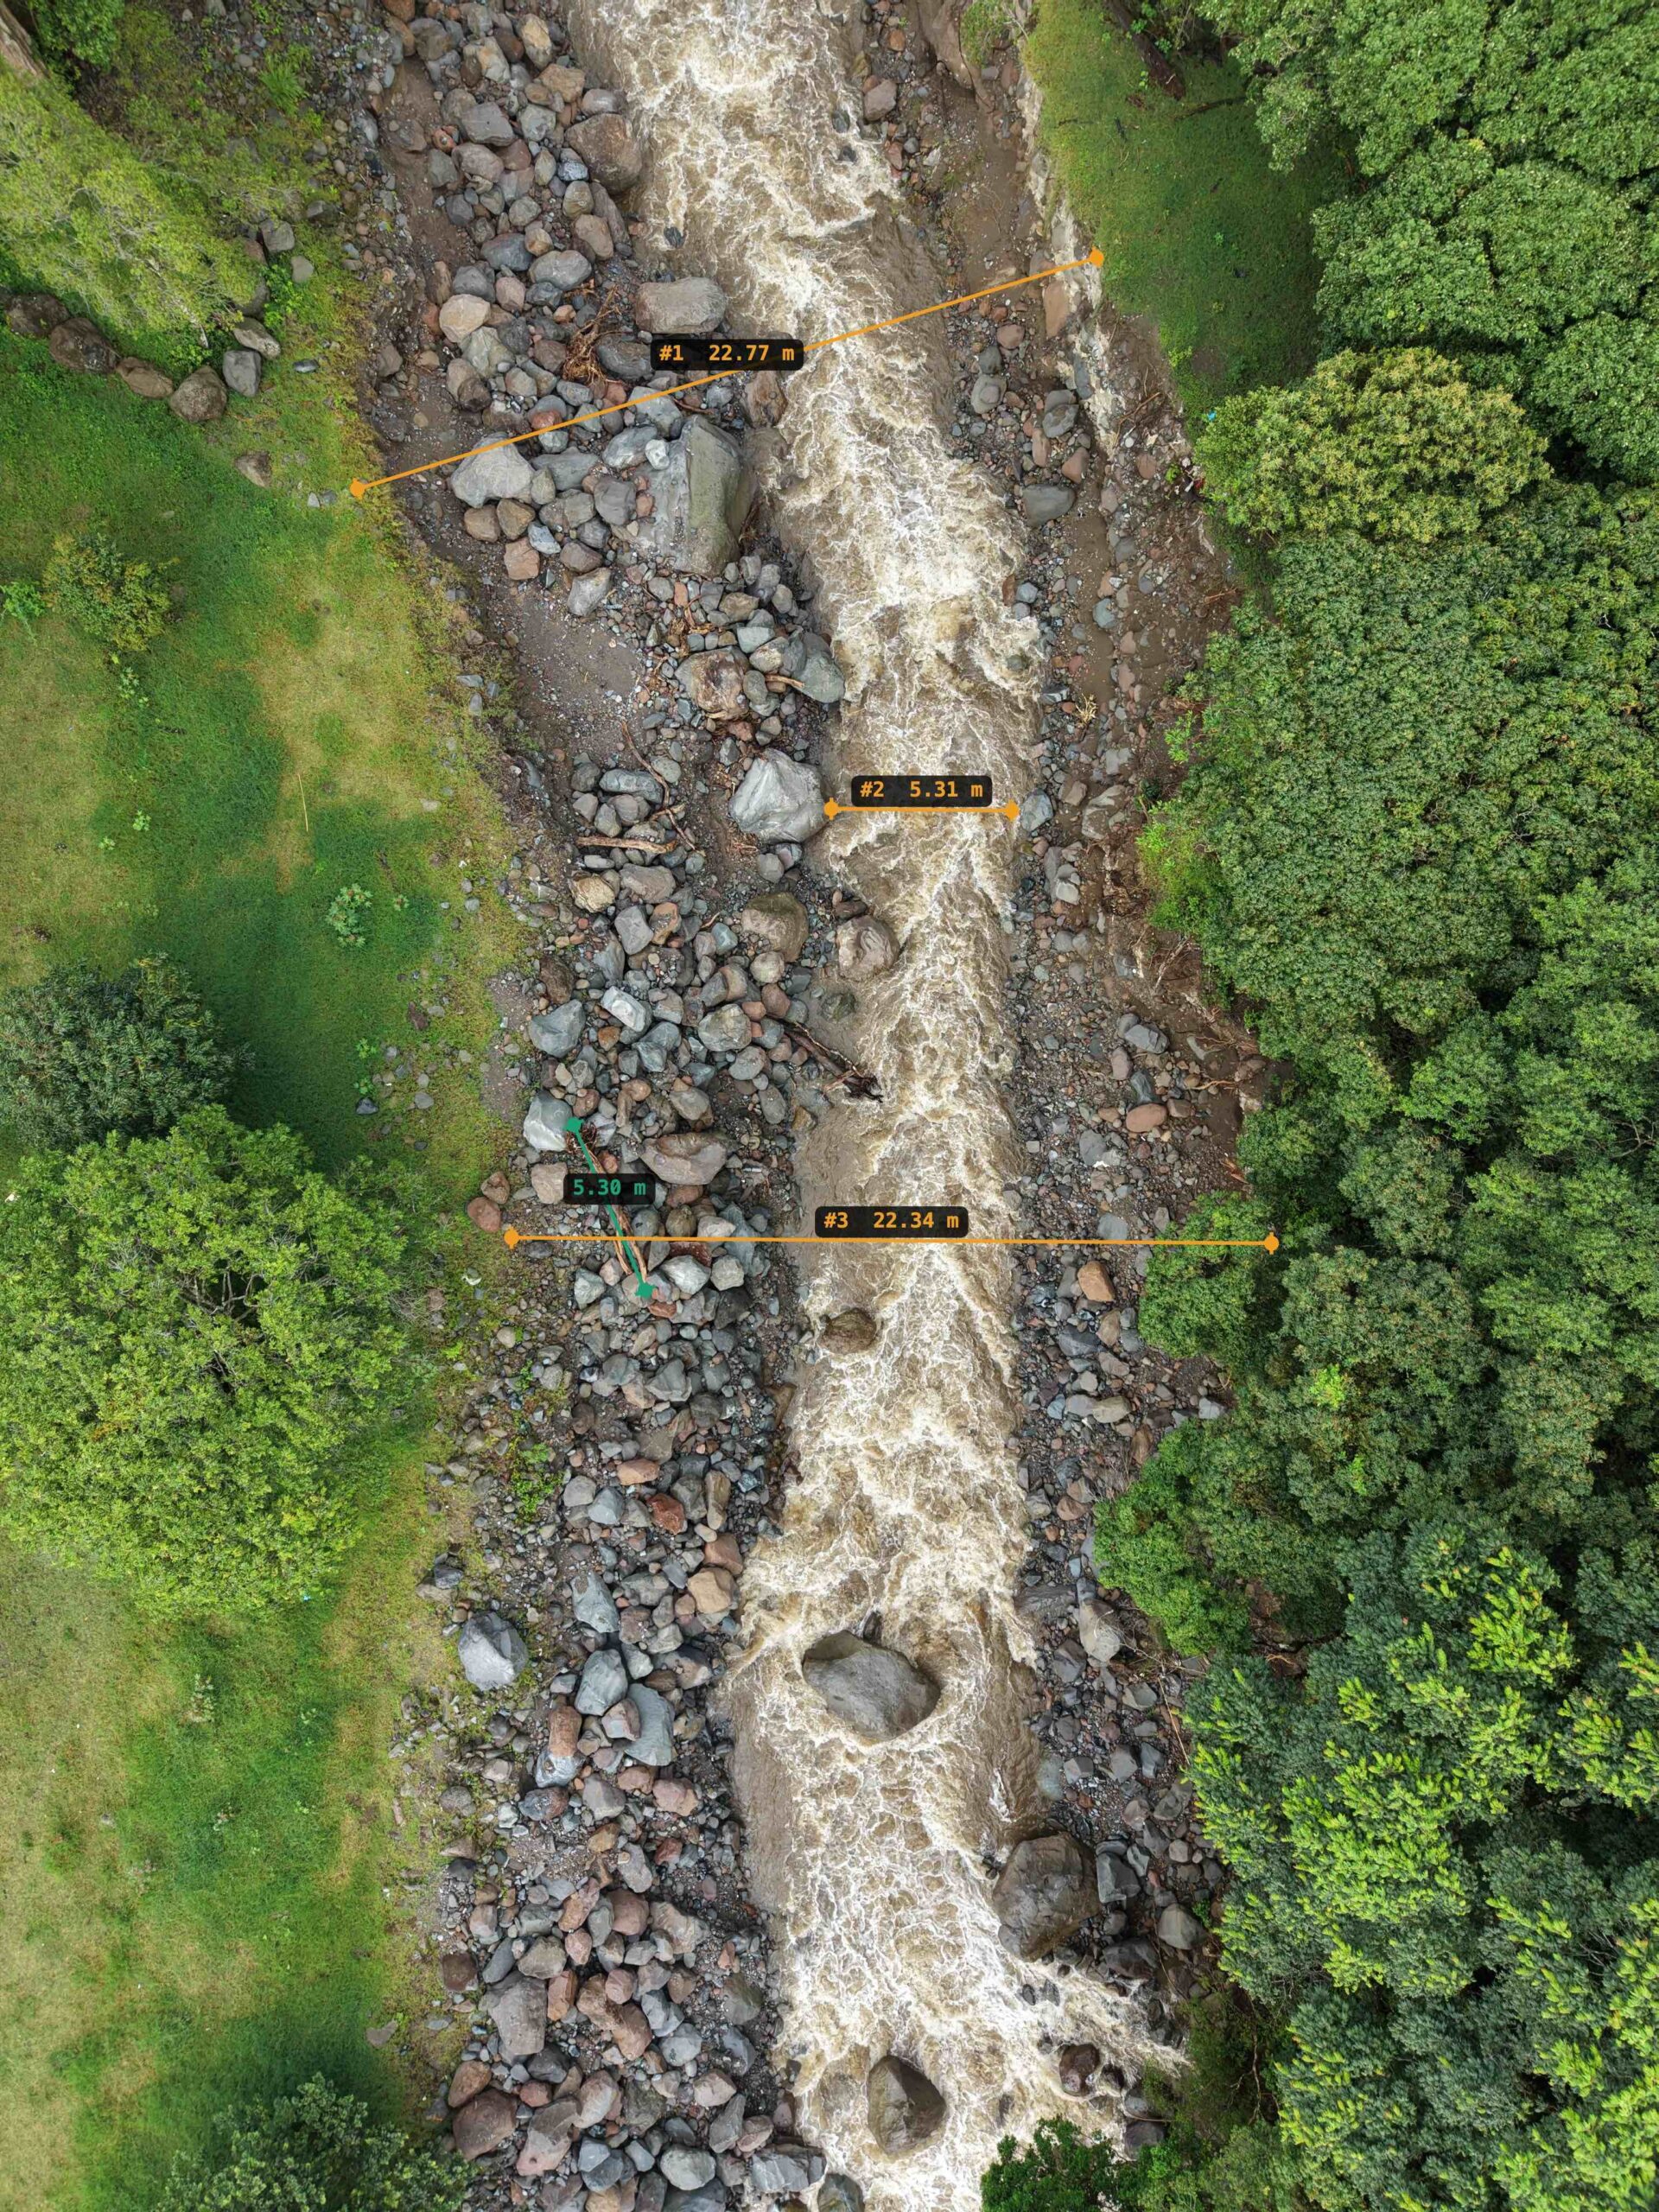
What worked best was to take drone photos from directly above the river. I measured objects on the ground and used them as reference points for calculations within the photo.
I used Google Earth to get the altitude above sea level at different points along the 800-meter stretch. Altitude can be used to calculate longitudinal slope, which is important when trying to figure out the intensity and power of the rushing water.
According to Google Earth, the altitude drops by 33 meters, from 1,558 to 1,525 meters above sea level during the 800-meter span. But I read that Google Earth altitude figures can be years and even decades old and are not necessarily coupled with satellite images. So if the river collapses a hillside, old altitude figures may not detect the change.
I decided to use flight logs from my DJI drone to make the calculations. The drone records altitude above sea level when recording video. So I placed the drone at different spots along the river and checked the altitude. The flight logs showed a drop of 44 meters, from 1,527 to 1,483 meter above sea level.
So the drop may be 33 meters. Or 44 meters. I couldn’t resolve the discrepancy, so I entered both figures into the AI model.
I studied characteristics of each section of the river. Is the channel natural or manmade? Are ancestral boulders present? Has the riverbed been dug up? This sort of information is used to calculate Manning’s roughness coefficient, or \(n\). A smoother channel like concrete has a low \(n\) value, while a river bottom filled with rocks has a higher \(n\) value that slows down water and raises flood levels.
I fed the information – which you can download here – into Google’s AI model, Gemini. Next I added three documents:
- A May 29, 2026, risk report covering this section of river. Panama’s National Civil Protection System, or SE wrote the report after visiting the site.
- A May 12, 2025, study called “Review of the hydrological effects of the extreme event Hurricane Eta in the Chiriquí Viejo River basin, November 2020.”
- A November 2024 Ministry of Public Works document containing technical information about the bridge, berm and canalization project.
Then I asked Gemini to produce four different flood scenarios using all the information. Here are the results:
Scenario 1: Peak Seasonal Flow – System in Equilibrium
This scenario represents standard annual maximum flows during peak rainy months, fully contained by Bagatrac’s engineered structures.
Hydraulics: The river stays confined inside the 30-meter-wide diverted channel created by the 87,500 m³ excavation project.
Armored Corridor: Water rounds the 45-degree curve smoothly. The 2,800 m³ of concrete mortar locks the stones in place, preventing any rock movement.
The Runoff Pipe: A 5-foot concrete pipe safely carries hillside runoff underneath the riverbed, preventing water from pooling at the base of the cliff.
Cliff Stability: Secure. The 30,000 m³ engineered berm completely blocks the river from accessing the old avulsion channel. The 72-foot vertical cliff face and its 25-foot talus rubble pile remain dry and undisturbed.
Scenario 2: 10-Year Storm – Stress Increases
A moderate extreme weather event with a 10% annual chance of occurrence, initiating early stress points upstream.
Hydraulics: Water depths rise to the top edges of the main channel boundaries.
Upstream Accelerated Nozzle: Upstream in Section 2, where some large boulders were moved aside, water velocities accelerate significantly through the straightened V-ditch. This rapid current applies heavy shear stress to the unarmored, erodible soil walls.
Berm and Wall Defense: Downstream, the 30,000 m³ berm and the grouted riprap walls handle the volume cleanly. The 6-to-7-meter threshold needed to overtop the dividing plain is not reached.
Cliff Stability: Low Risk. Rainwater saturates the upper volcanic plateau from above, causing minor surface slumping around the active cave-in void behind the white house.
Scenario 3: 50-Year Storm – The Breakout Point
A major severe weather event with a 2% annual probability, pushing the river’s high-velocity currents to the absolute limit of the channel’s capacity.
Flume Velocity Acceleration: Due to the smooth, concrete-grouted right wall and the steep 4.75% slope, the river behaves like a high-speed water slide, accelerating to velocities between 8.5 and 9.6 m/s.
The 6-to-7-Meter Breach: As the torrent hits the 45-degree curve, the immovable grouted wall forces the water to stack vertically. The river breaches the 6-to-7-meter height threshold, overtopping the 30,000 m³ engineered berm.
Overflow Plain Flooding: Breakout water pours down the secondary channel. The water inundates the gravel plain and begins to submerge the 25-foot talus rubble pile at the base of the cliff.
Bridge Corridor Stress: The columnless 45-meter single-span bridge survives direct hydraulic forces cleanly. However, because the right wall is immovable, the breakout water aggressively scours the unarmored earthen ramp supporting the bridge’s left approach road.
Scenario 4: Hurricane Eta-Magnitude Storm – Catastrophic System Failure?
A catastrophic regional disaster matching historical peaks, where a massive volumetric flow rate of 638.03 m³/s completely overwhelms the engineered valley.
Catastrophic Overtopping: The massive 638.03 m³/s flow rate hits the 16-meter bottleneck at the bridge, creating a severe “backwater effect.” The 30,000 m³ berm is completely drowned under meters of water.
Destruction of the Cliff Base: The secondary channel becomes a roaring river branch. The high-velocity torrent aggressively sweeps away the 25-foot unconsolidated talus slope at the bottom of the cliff. By removing this natural support wedge, the 72-foot vertical cliff face loses its structural foundation.
Plateau Liquefaction: Simultaneously, 70 mm of immediate surface runoff pours from the plateau straight into the active cave-in crater behind the white house. Saturated from above and cut away from below, the cliff face suffers a massive, deep-seated landslide, pulling the remaining buildings down.
Bridge Isolation: The 5-foot pipe is overwhelmed. The water forces its way along the outside of the pipe, washing out the asphalt, subbase, and capabase of the 400-meter road corridor. While the 45-meter concrete/steel bridge deck stands perfectly intact, it is left completely isolated as an unreachable island in the river.
 I don’t pretend to know what will happen the next time an extreme storm hits. This analysis can’t take the place of a professional hydraulic study of the river. Nor does it take into account the wisdom of professional engineers who built the bridge, berm and fortified channel aimed at protecting residents who have lived along the river for decades.
But I can’t help but be fascinated by AI’s insights about the river. I asked Gemini to examine photos of the river to add depth to the scenarios. Here are the results:
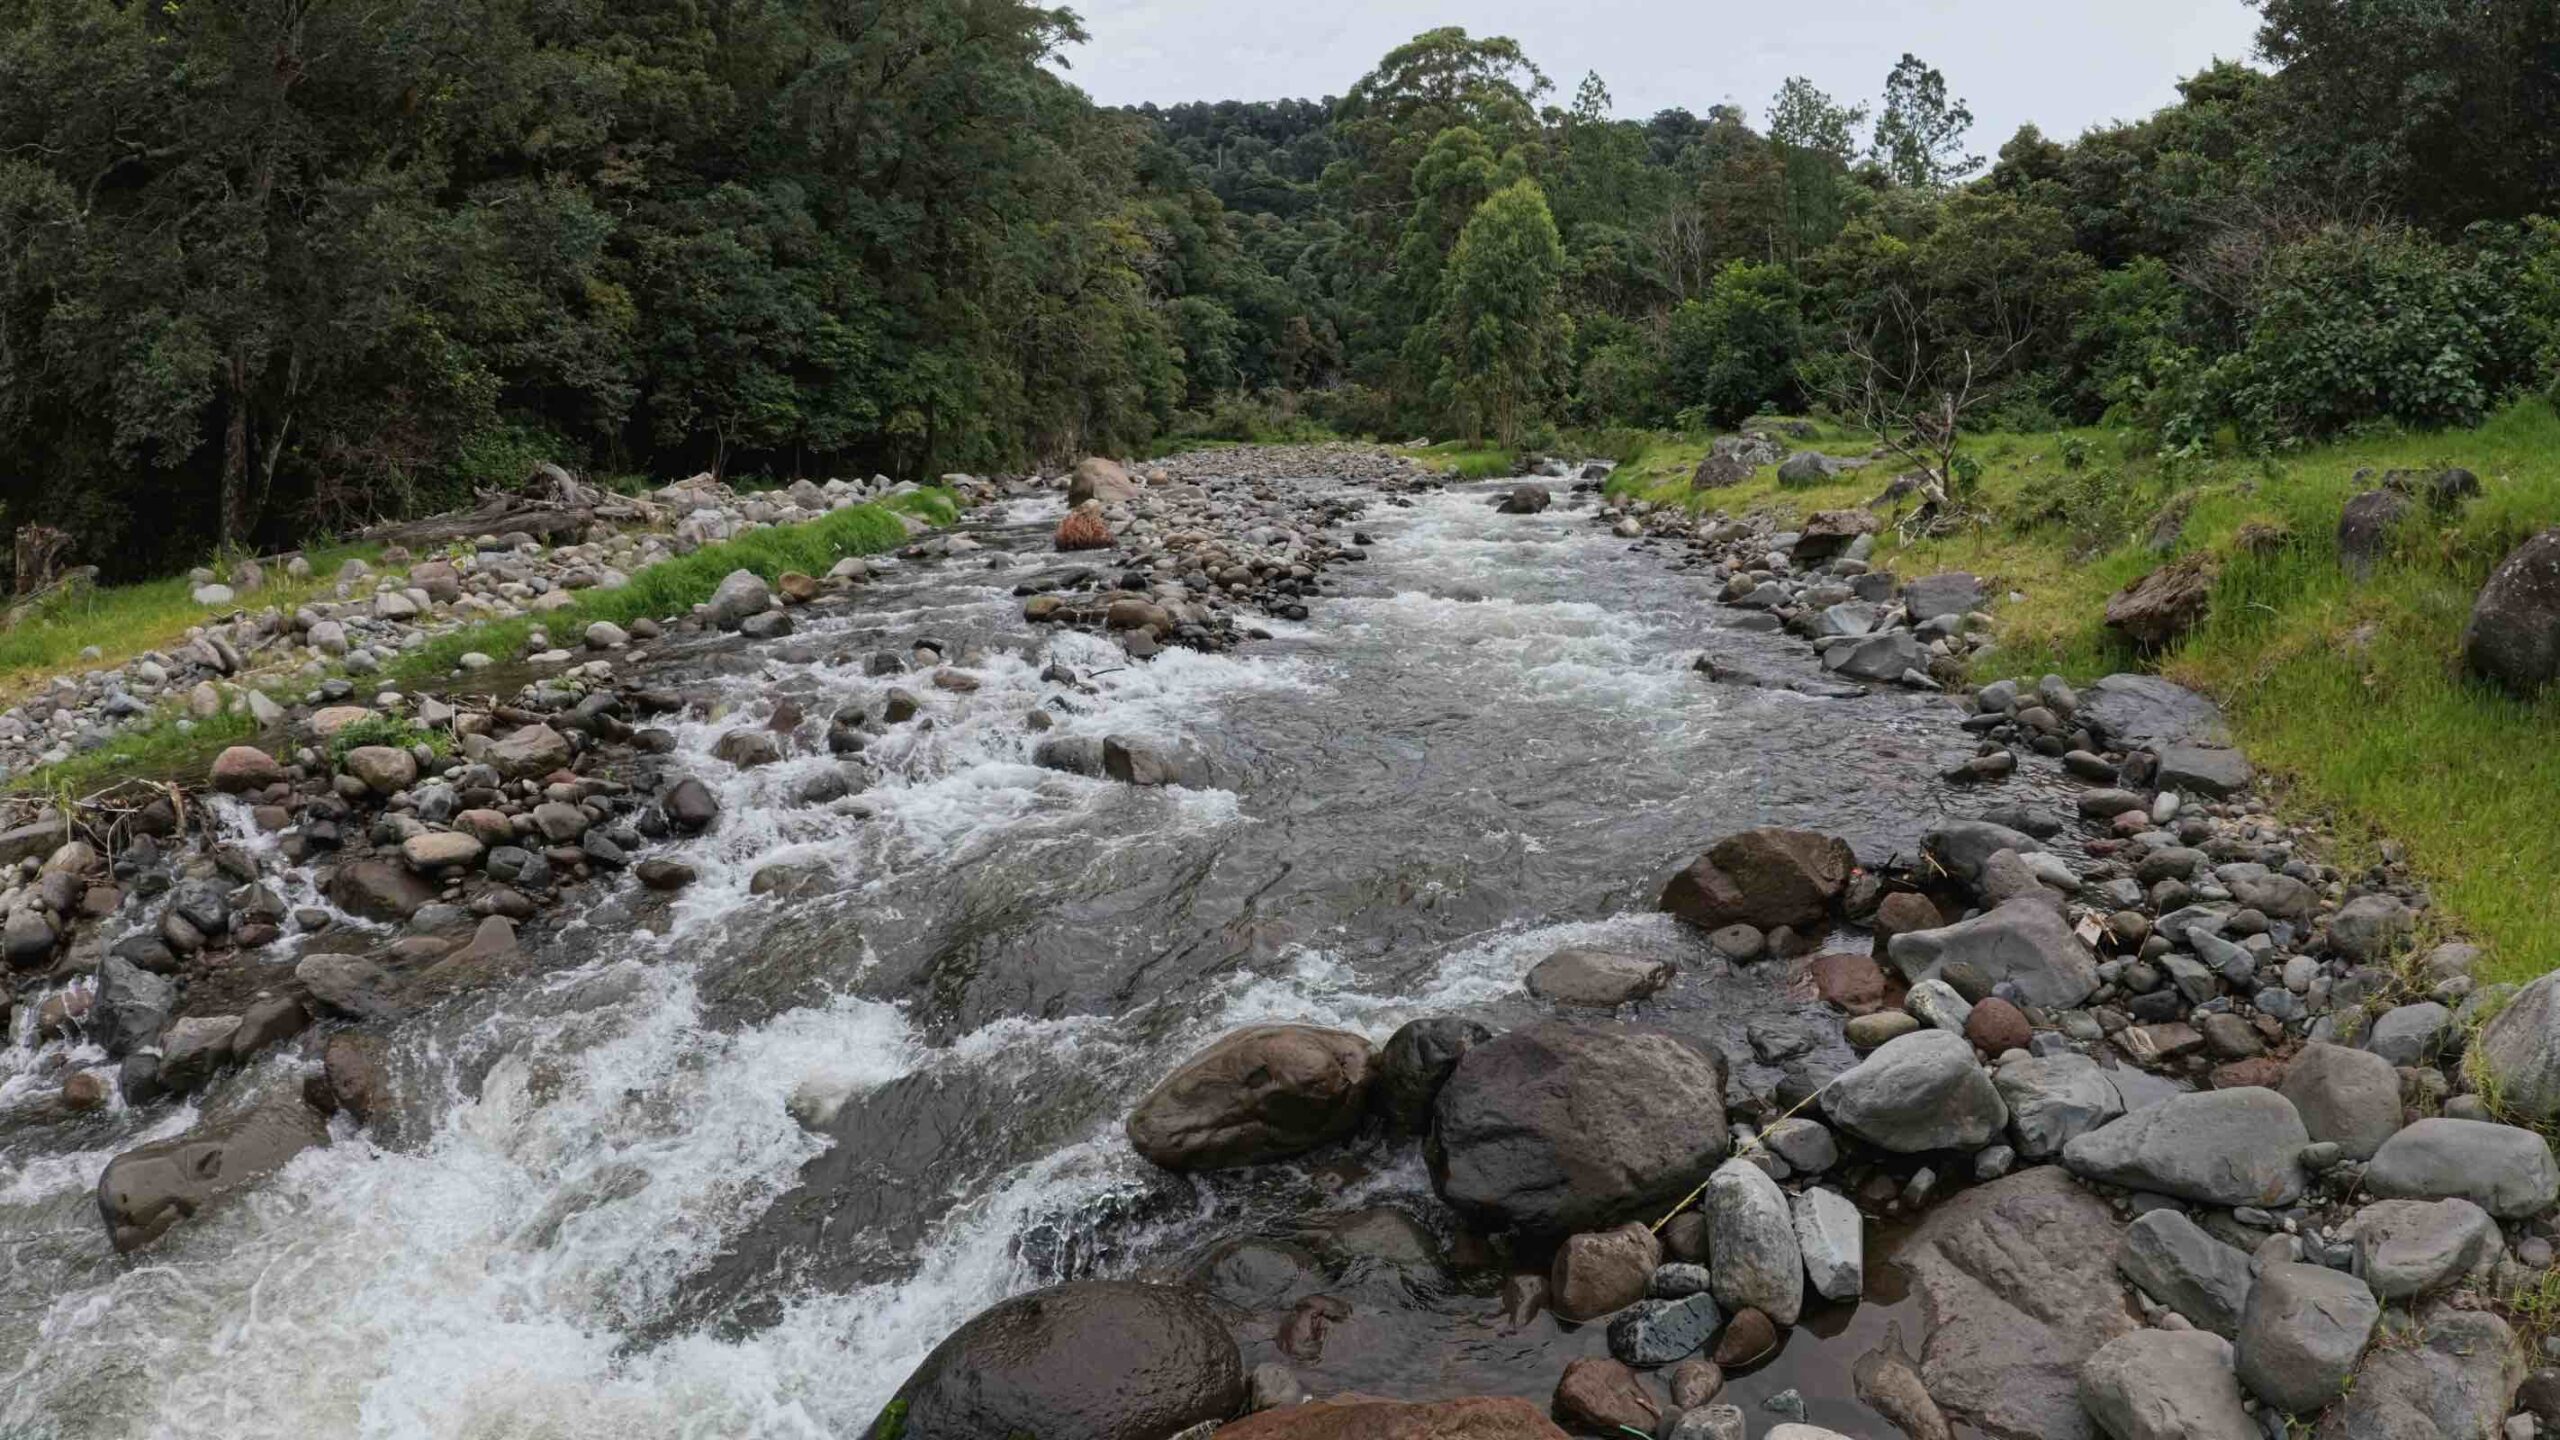 This photo of Section 1 illustrates the river in its original, un-engineered state. The Chiriquí Viejo riverbed is a chaotic, wide, and shallow field completely packed with a wide variety of rock sizes—ranging from small cobbles to massive, multi-ton boulders. As the rapid water weaves through this rocky layout, the rocks act as thousands of tiny brakes. This high roughness slows the average flow speed down significantly.
Low-lying, wide gravel bars topped with dense vegetation and mature trees also help absorb the surge safely, and the dense, mature forest canopy with thick root systems holds the hillside together.
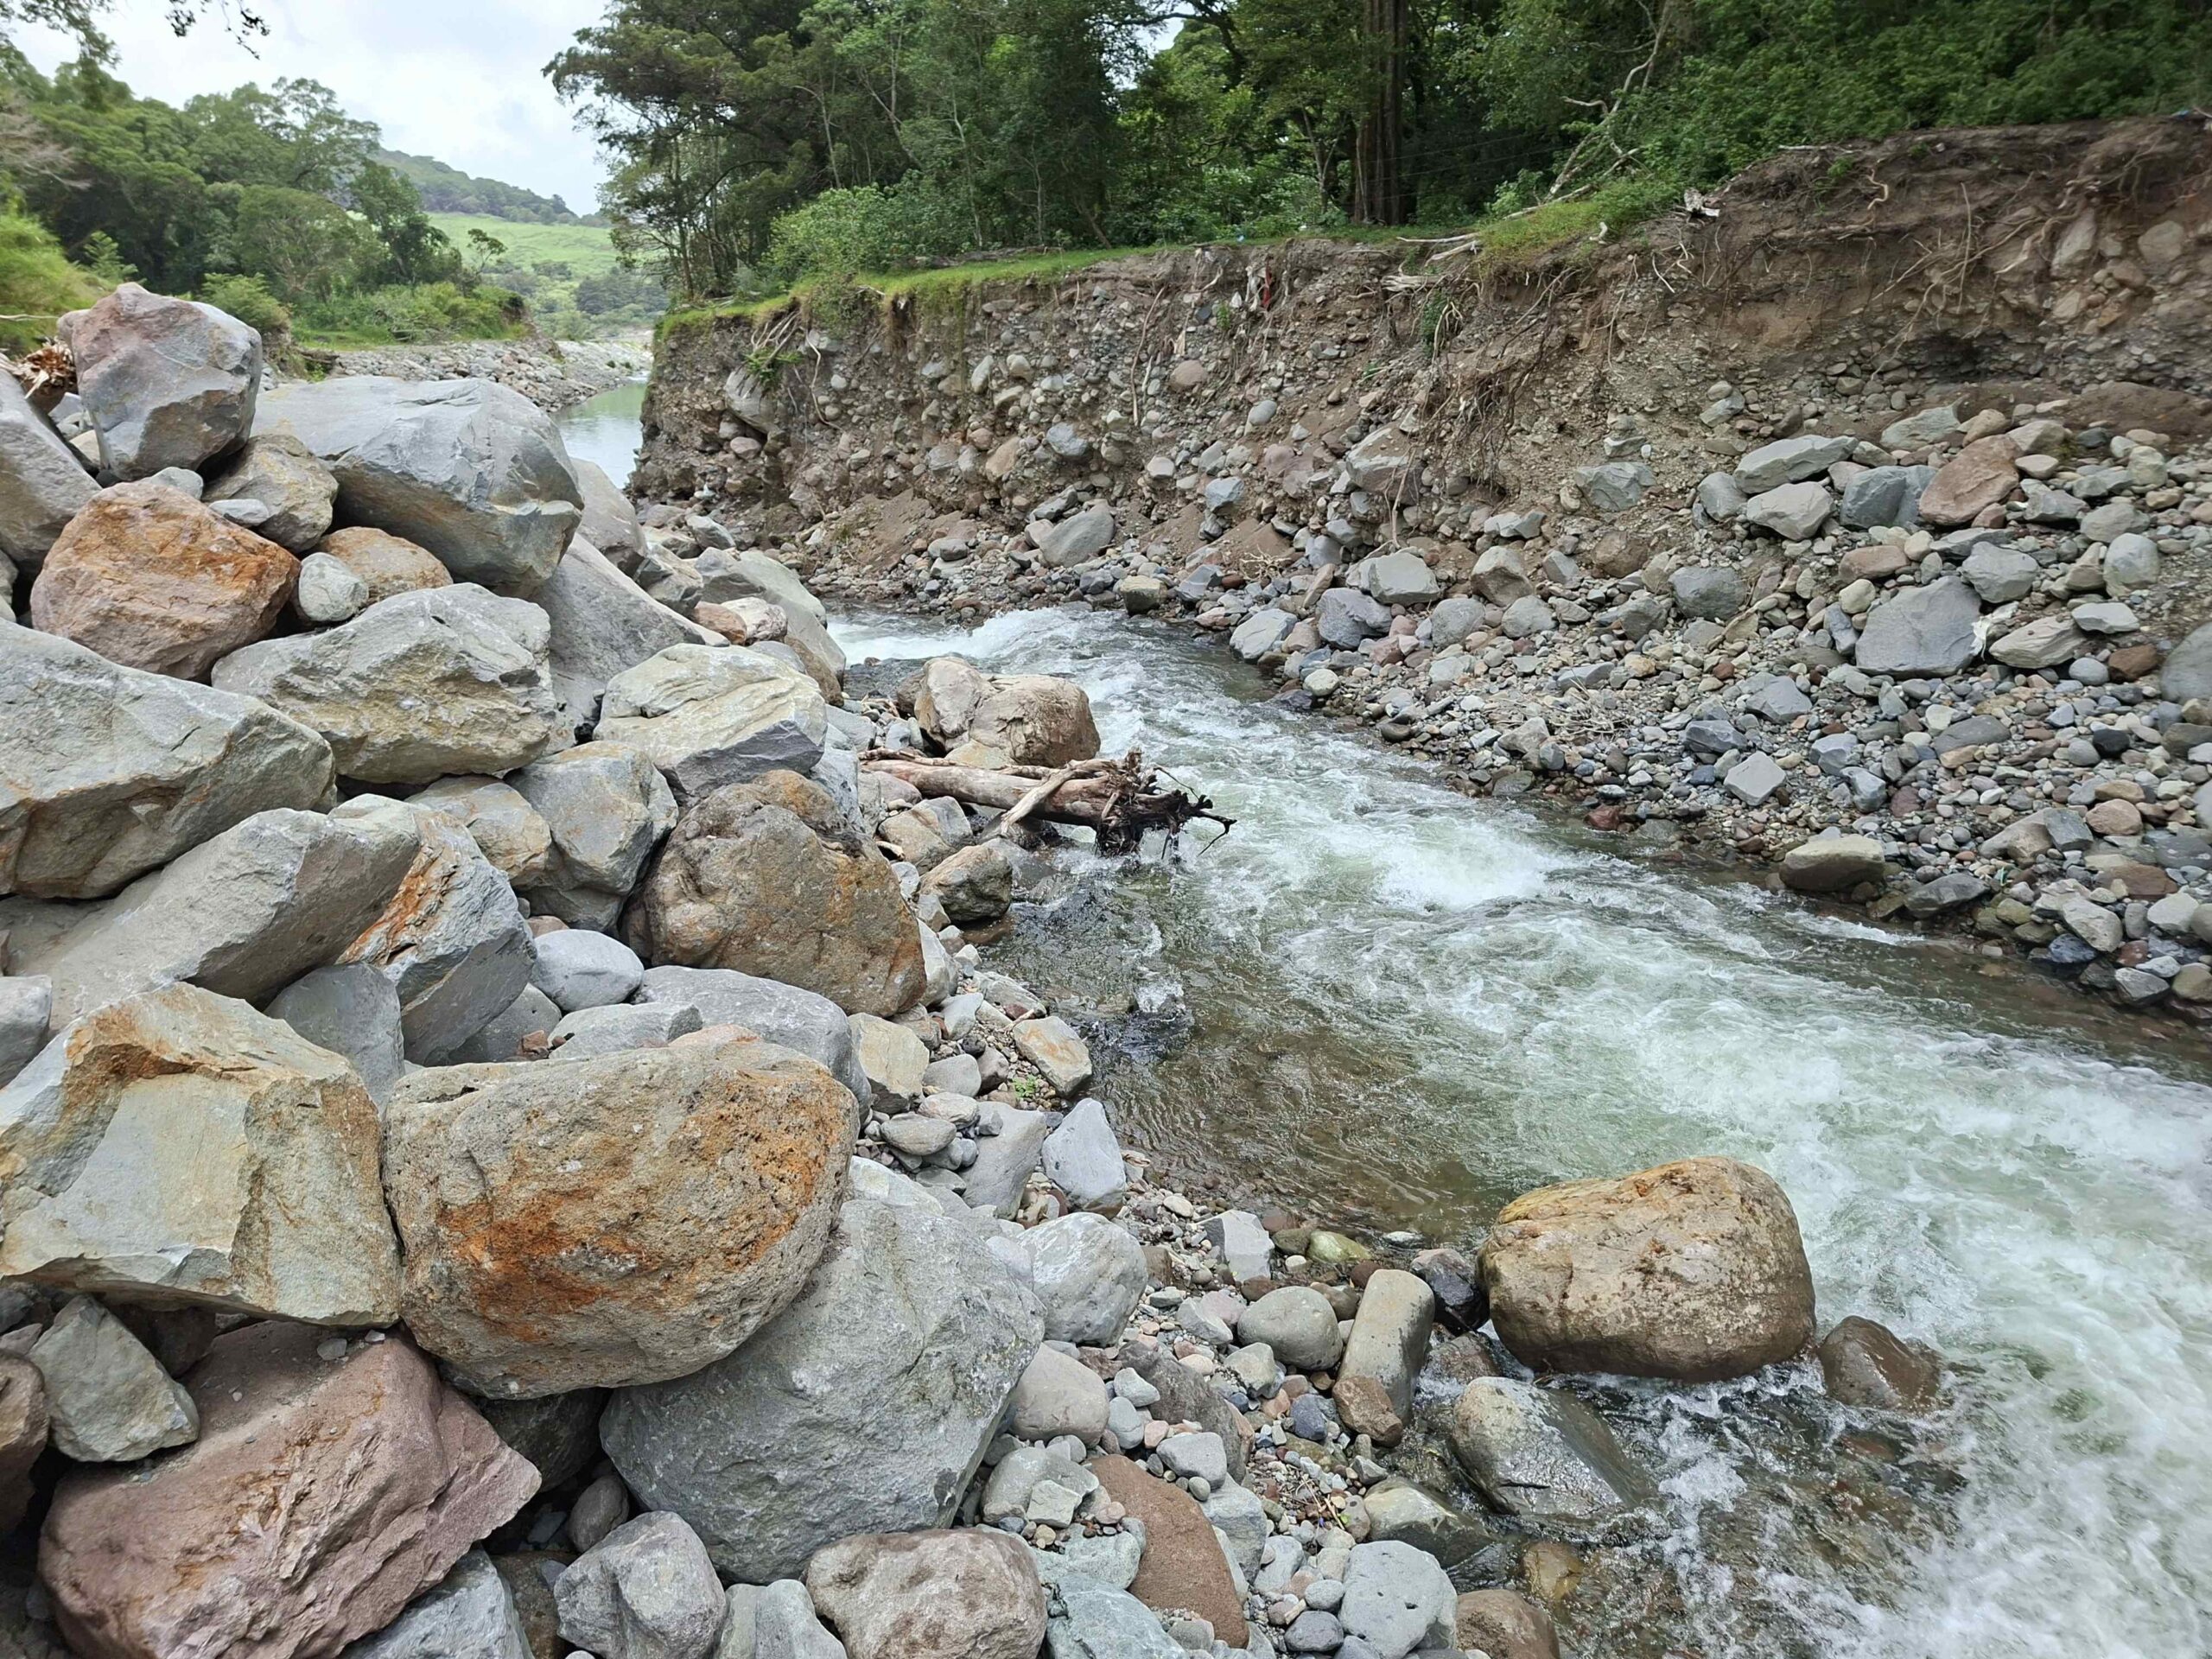 This photo in Section 2 visually confirms several hydraulic and geotechnical risks. The sheer vertical bank on the right side of the photo is a textbook example of a colluvial/alluvial mix—unconsolidated, loose dirt heavily mixed with round river gravel and small cobbles. There is zero structural binding material holding this wall together. The soil relies entirely on gravity and a very thin, failing root layer at the top edge. High-velocity currents will easily wash out the dirt surrounding the stones. That will cause the upper sections of the bank to shear off and collapse directly into the river.
The left side of the photo shows a closer view of the boulders pulled from the riverbed. These are massive, heavy boulders, but they are completely unbound and unanchored. They are simply stacked on top of one another. During an extreme storm, high-pressure water will force its way through wide gaps between the boulders. The water will wash away the smaller gravel and dirt sitting behind these boulders, causing the entire stack to tilt, slide, and crumble back into the active channel.
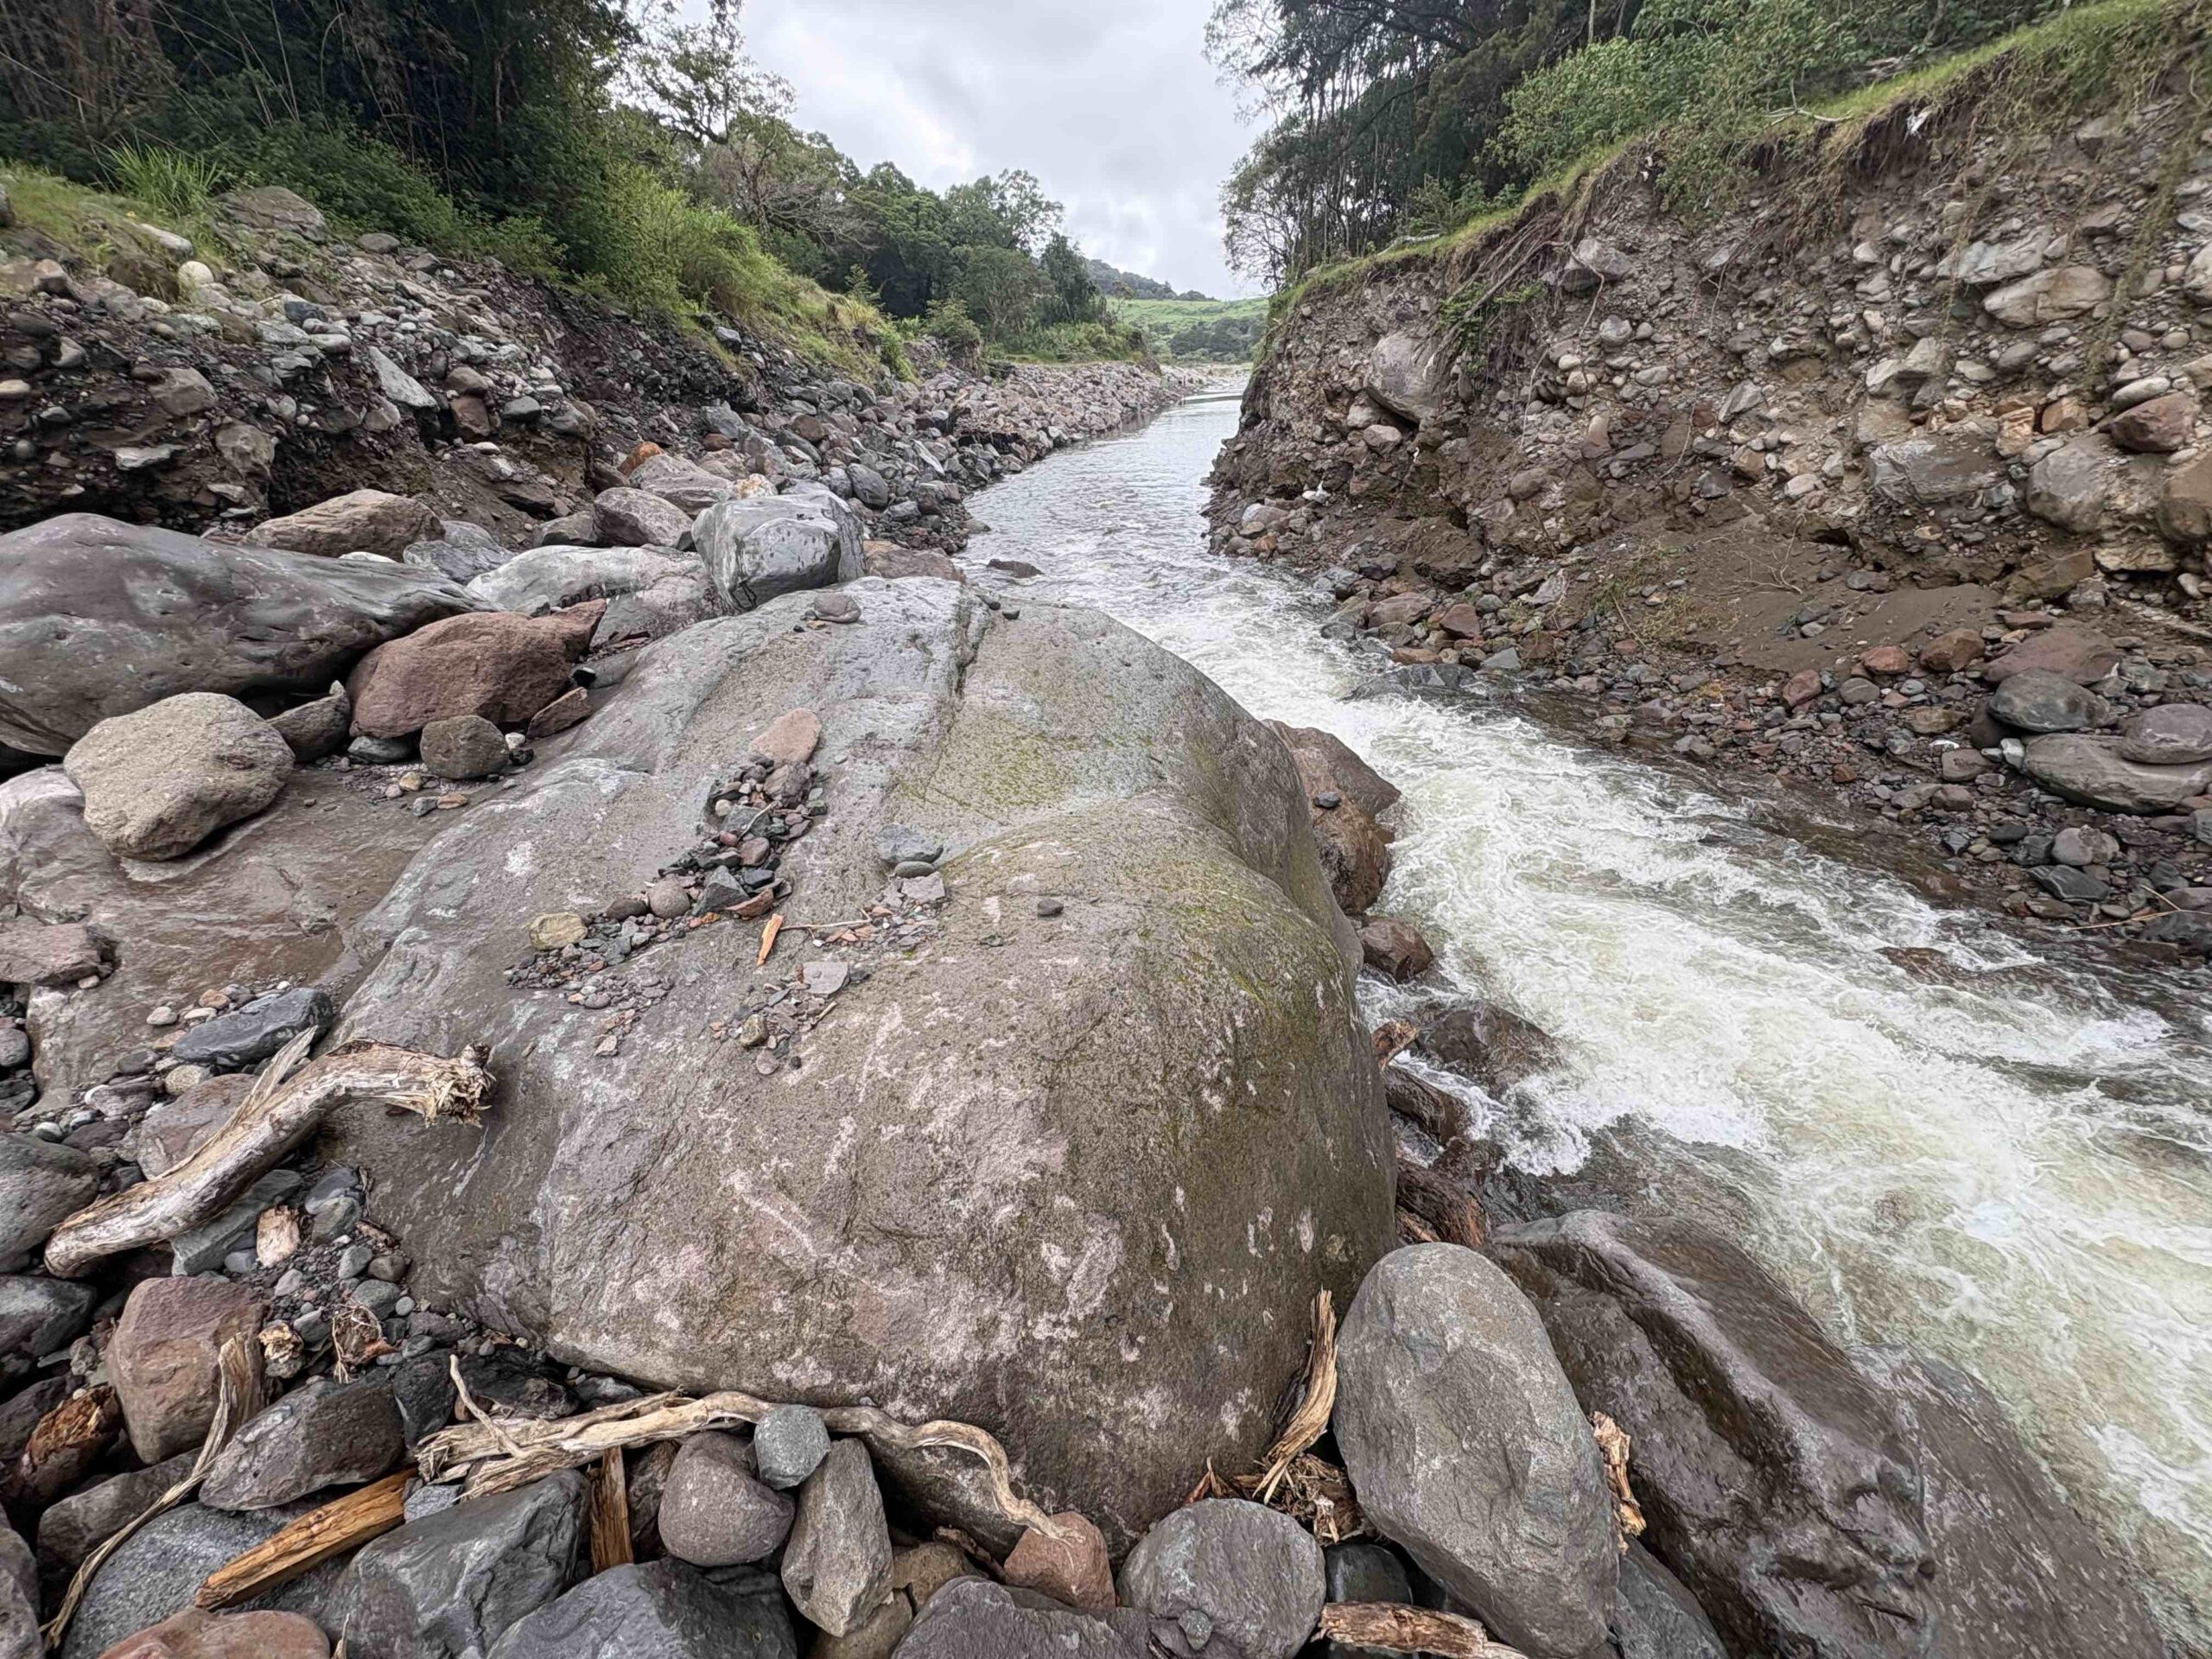 Also in Section 2, the massive ancestral boulder in the center foreground is firmly wedged into the riverbed. Because this giant rock is stationary, it forces the entire volume of the river to squeeze into a narrow, fast-moving chute on its right side. This constriction creates a powerful localized jet of water. The turbulent white water seen shooting past the boulder is actively blasting straight into the base of the weak right bank, accelerating the erosion process even during standard seasonal flows.
 During a 50-year storm, this narrow V-shaped ditch is not just an empty space for water to spread out. It functions as a massive debris dump. The river will rapidly deposit mountain sediment here, quickly filling up the plain and lifting the flood level even higher.
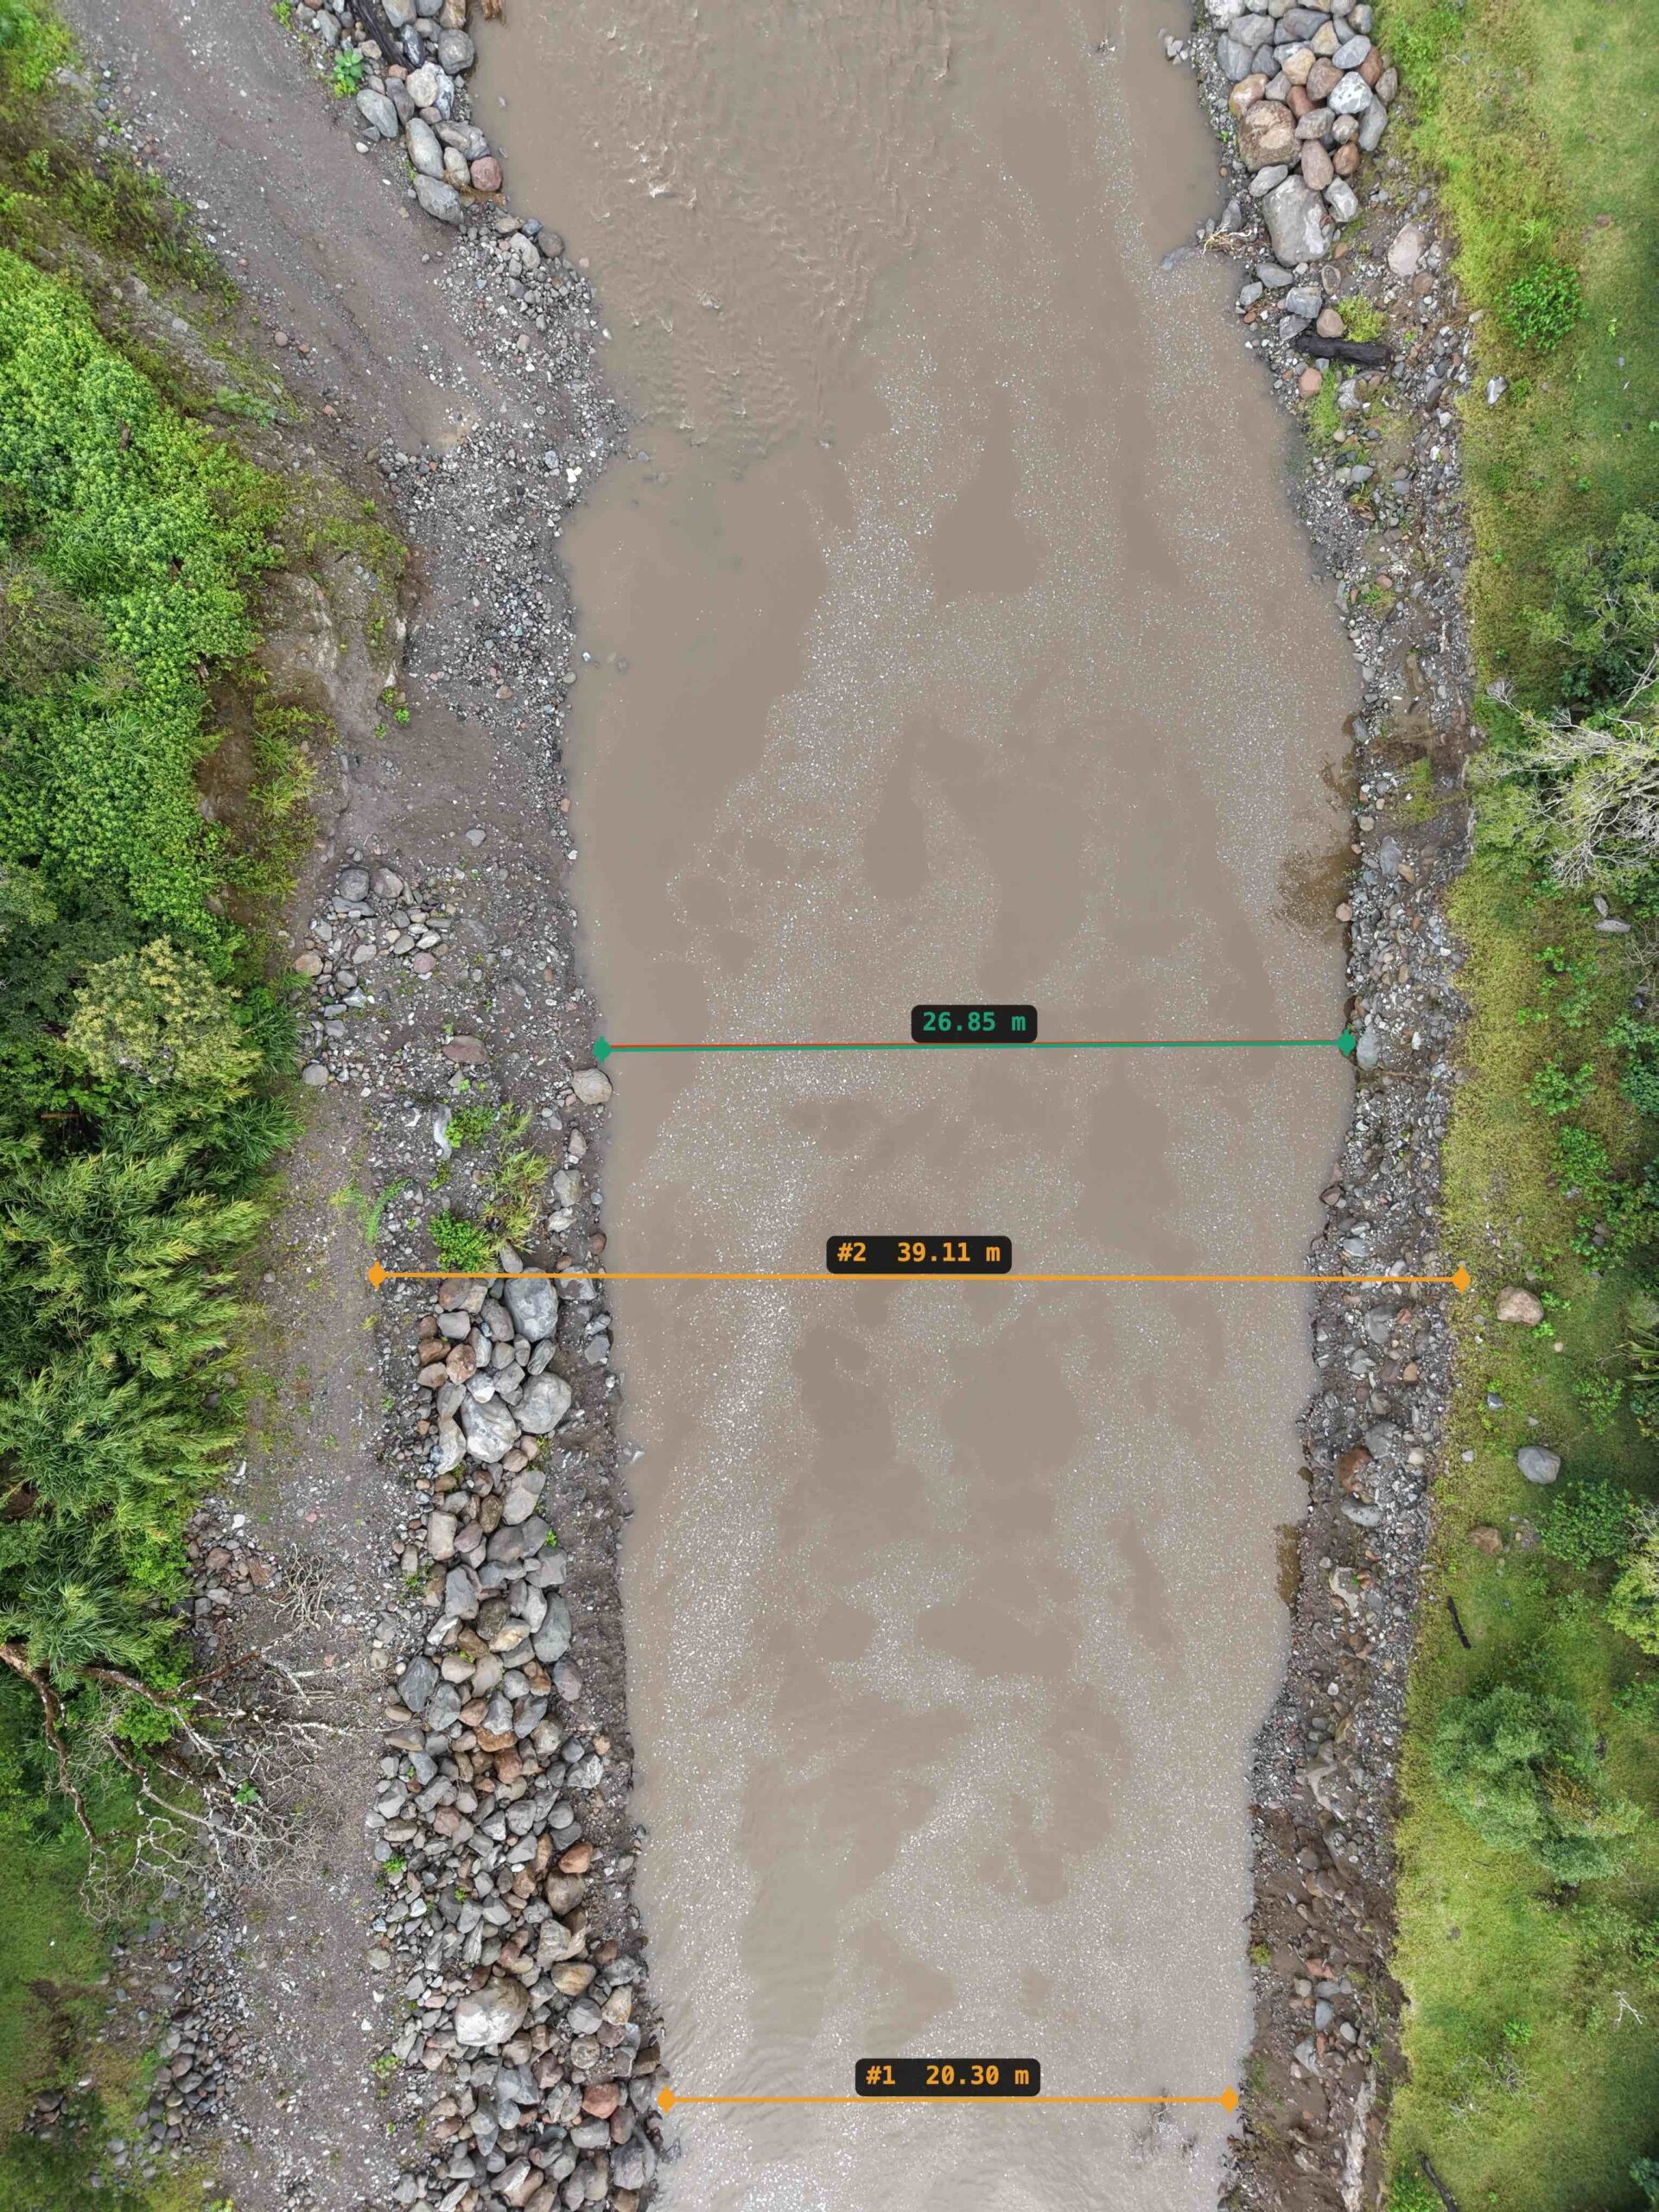 Further downriver, this deep basin serves as a massive buffer to collect and slow down the sharp downward surge coming out of Section 2.
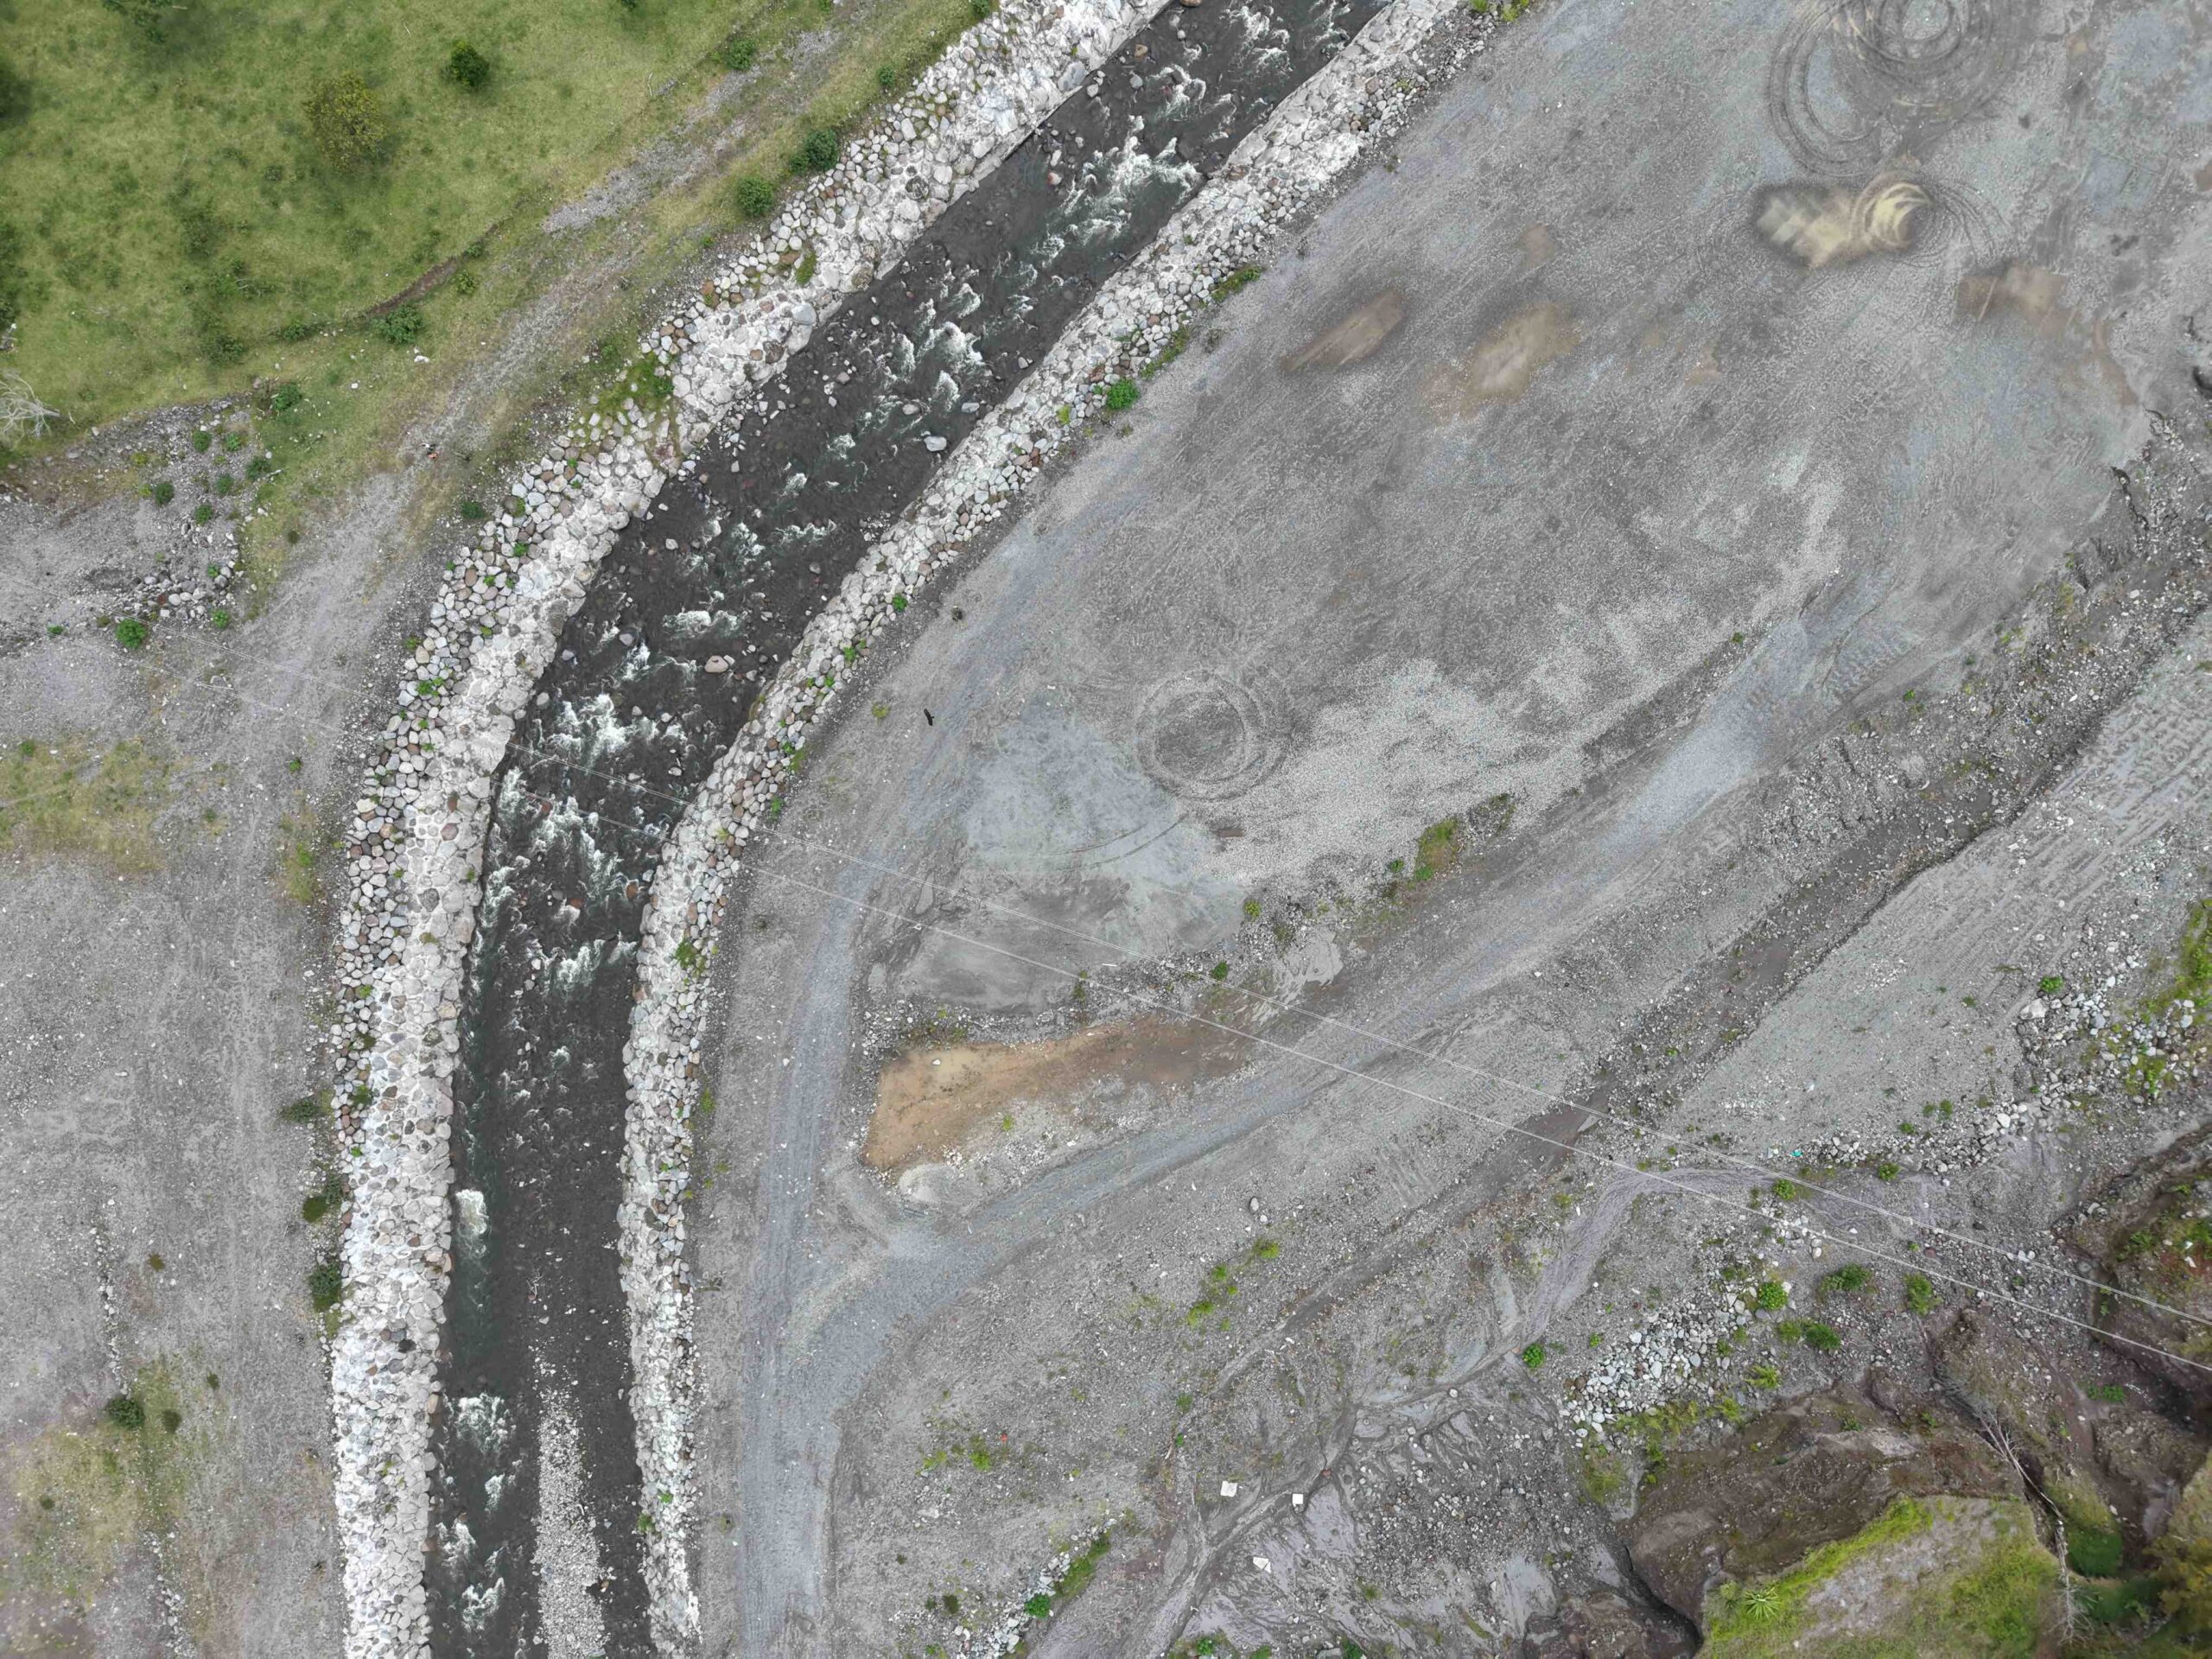 The concrete and riprap armor in Sections 3 and 4 prevent severe bank erosion precisely where the river takes a 45-degree turn.
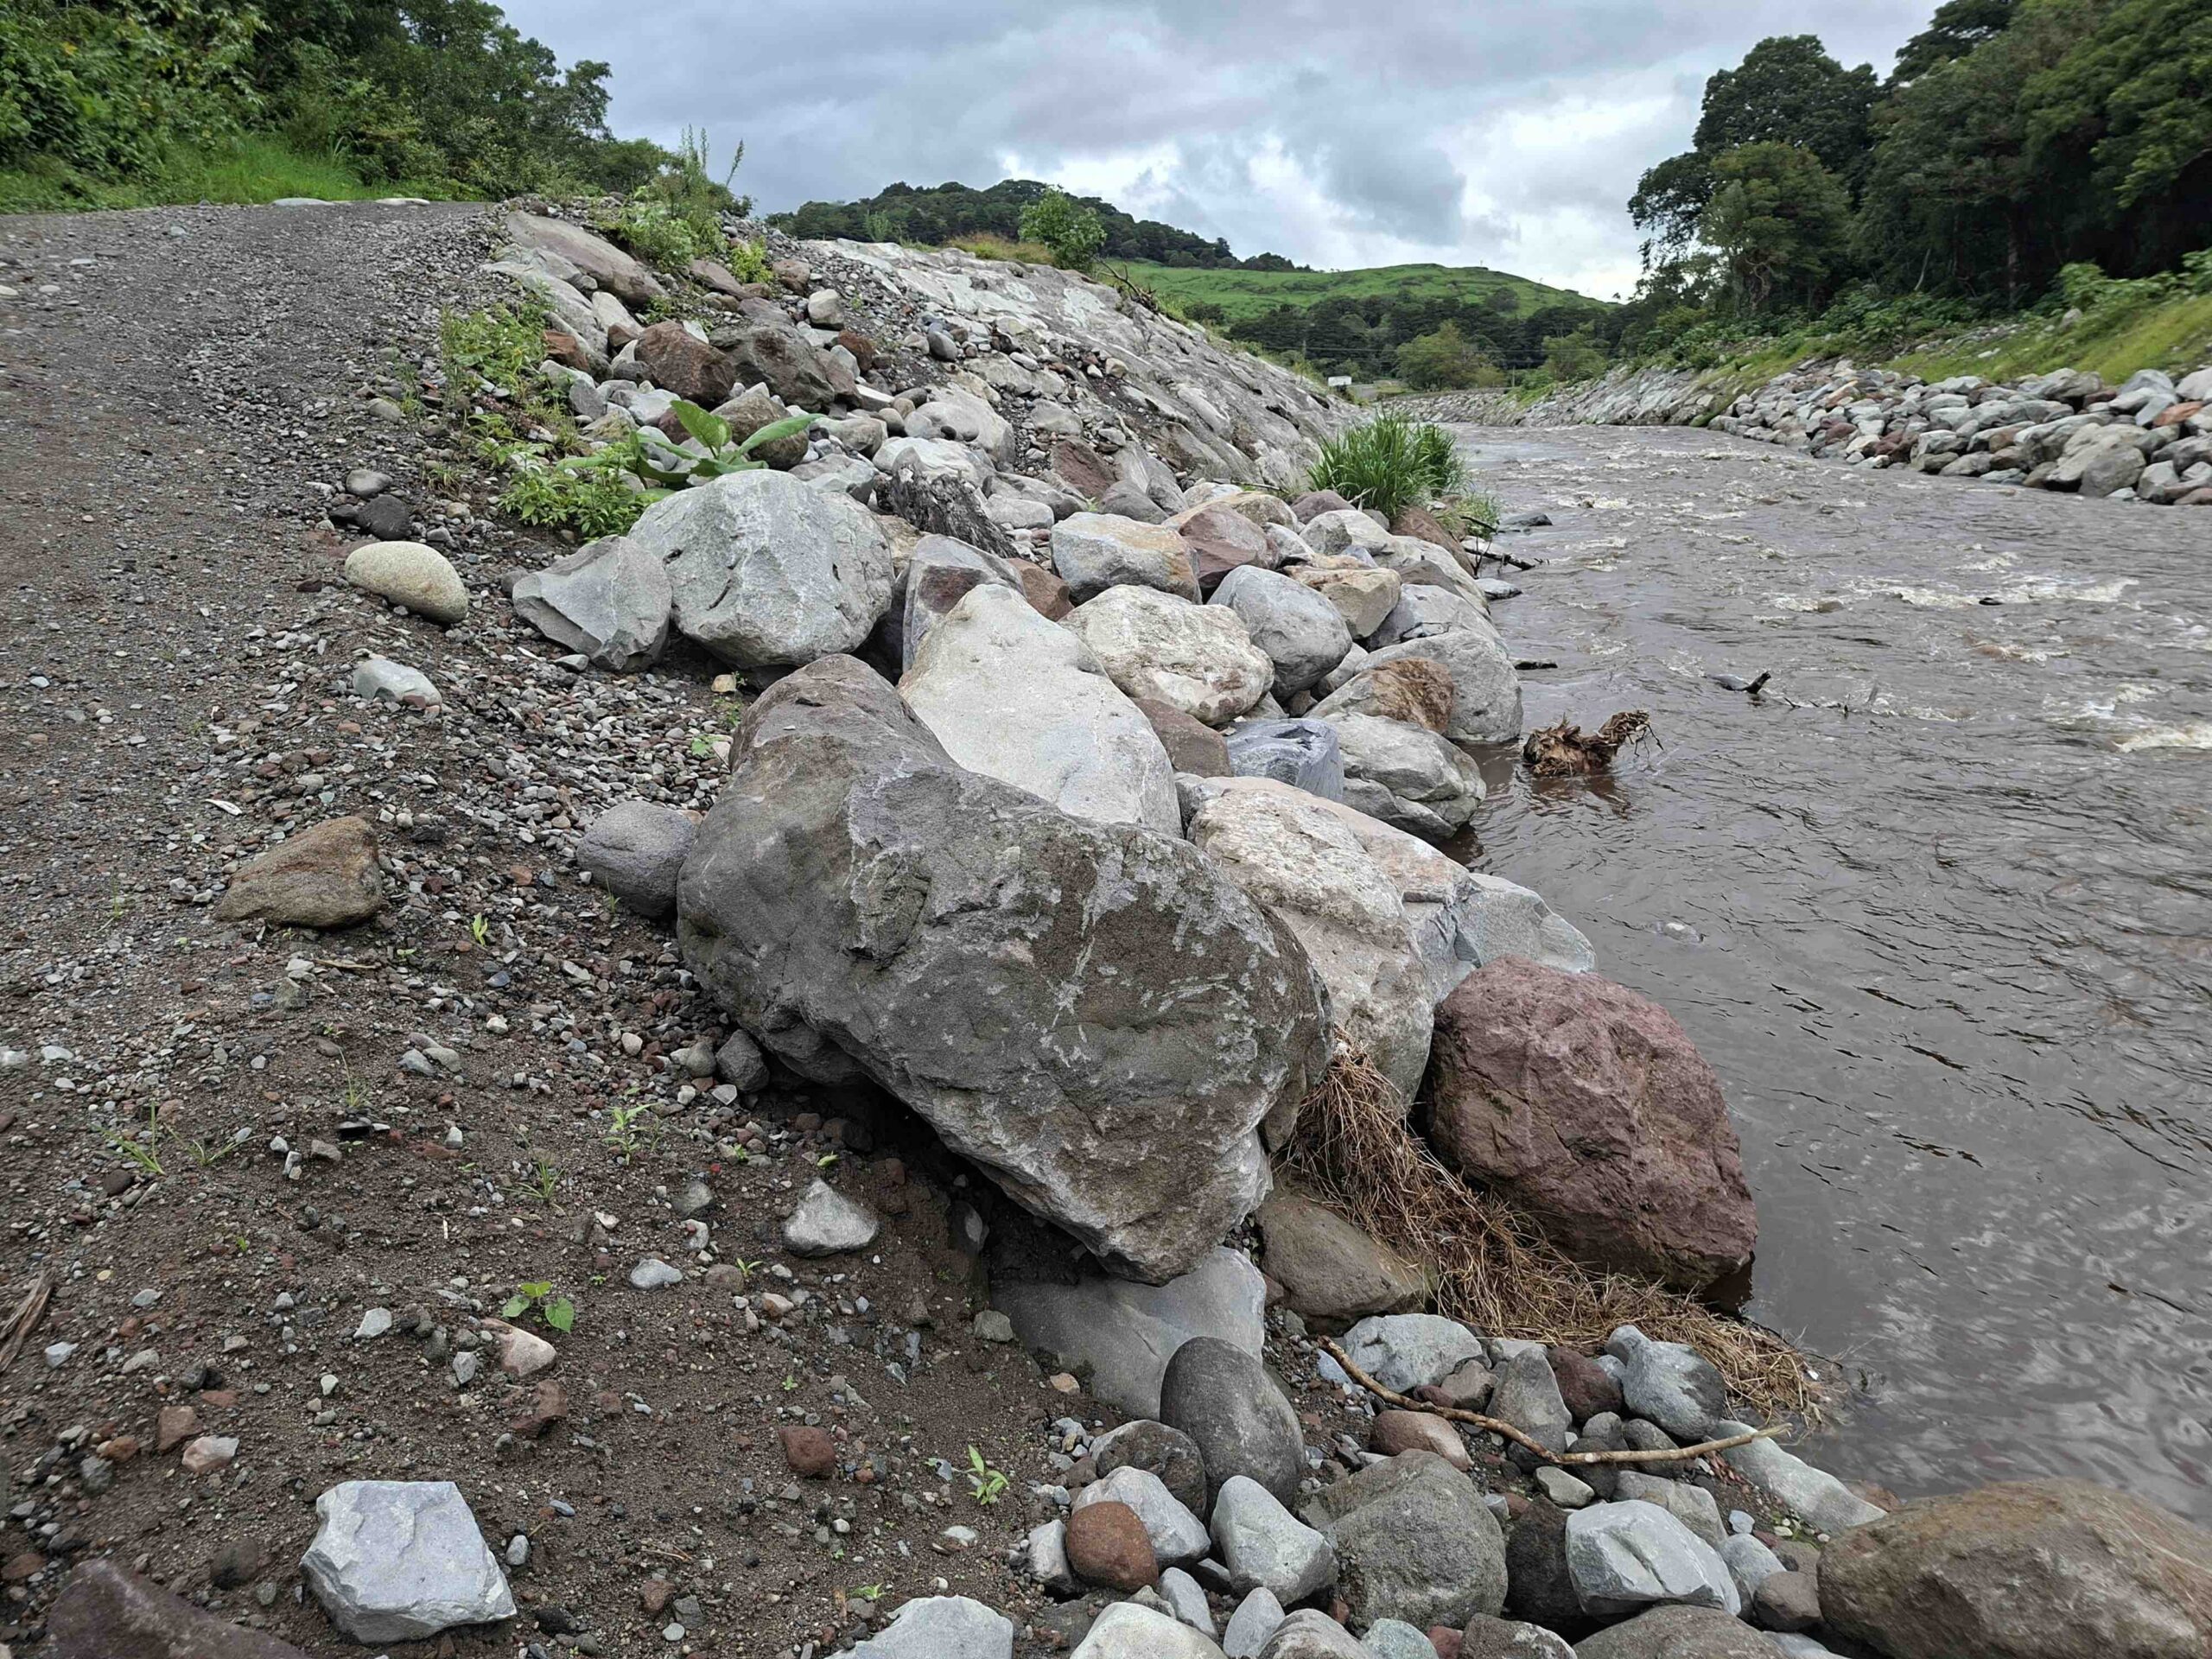
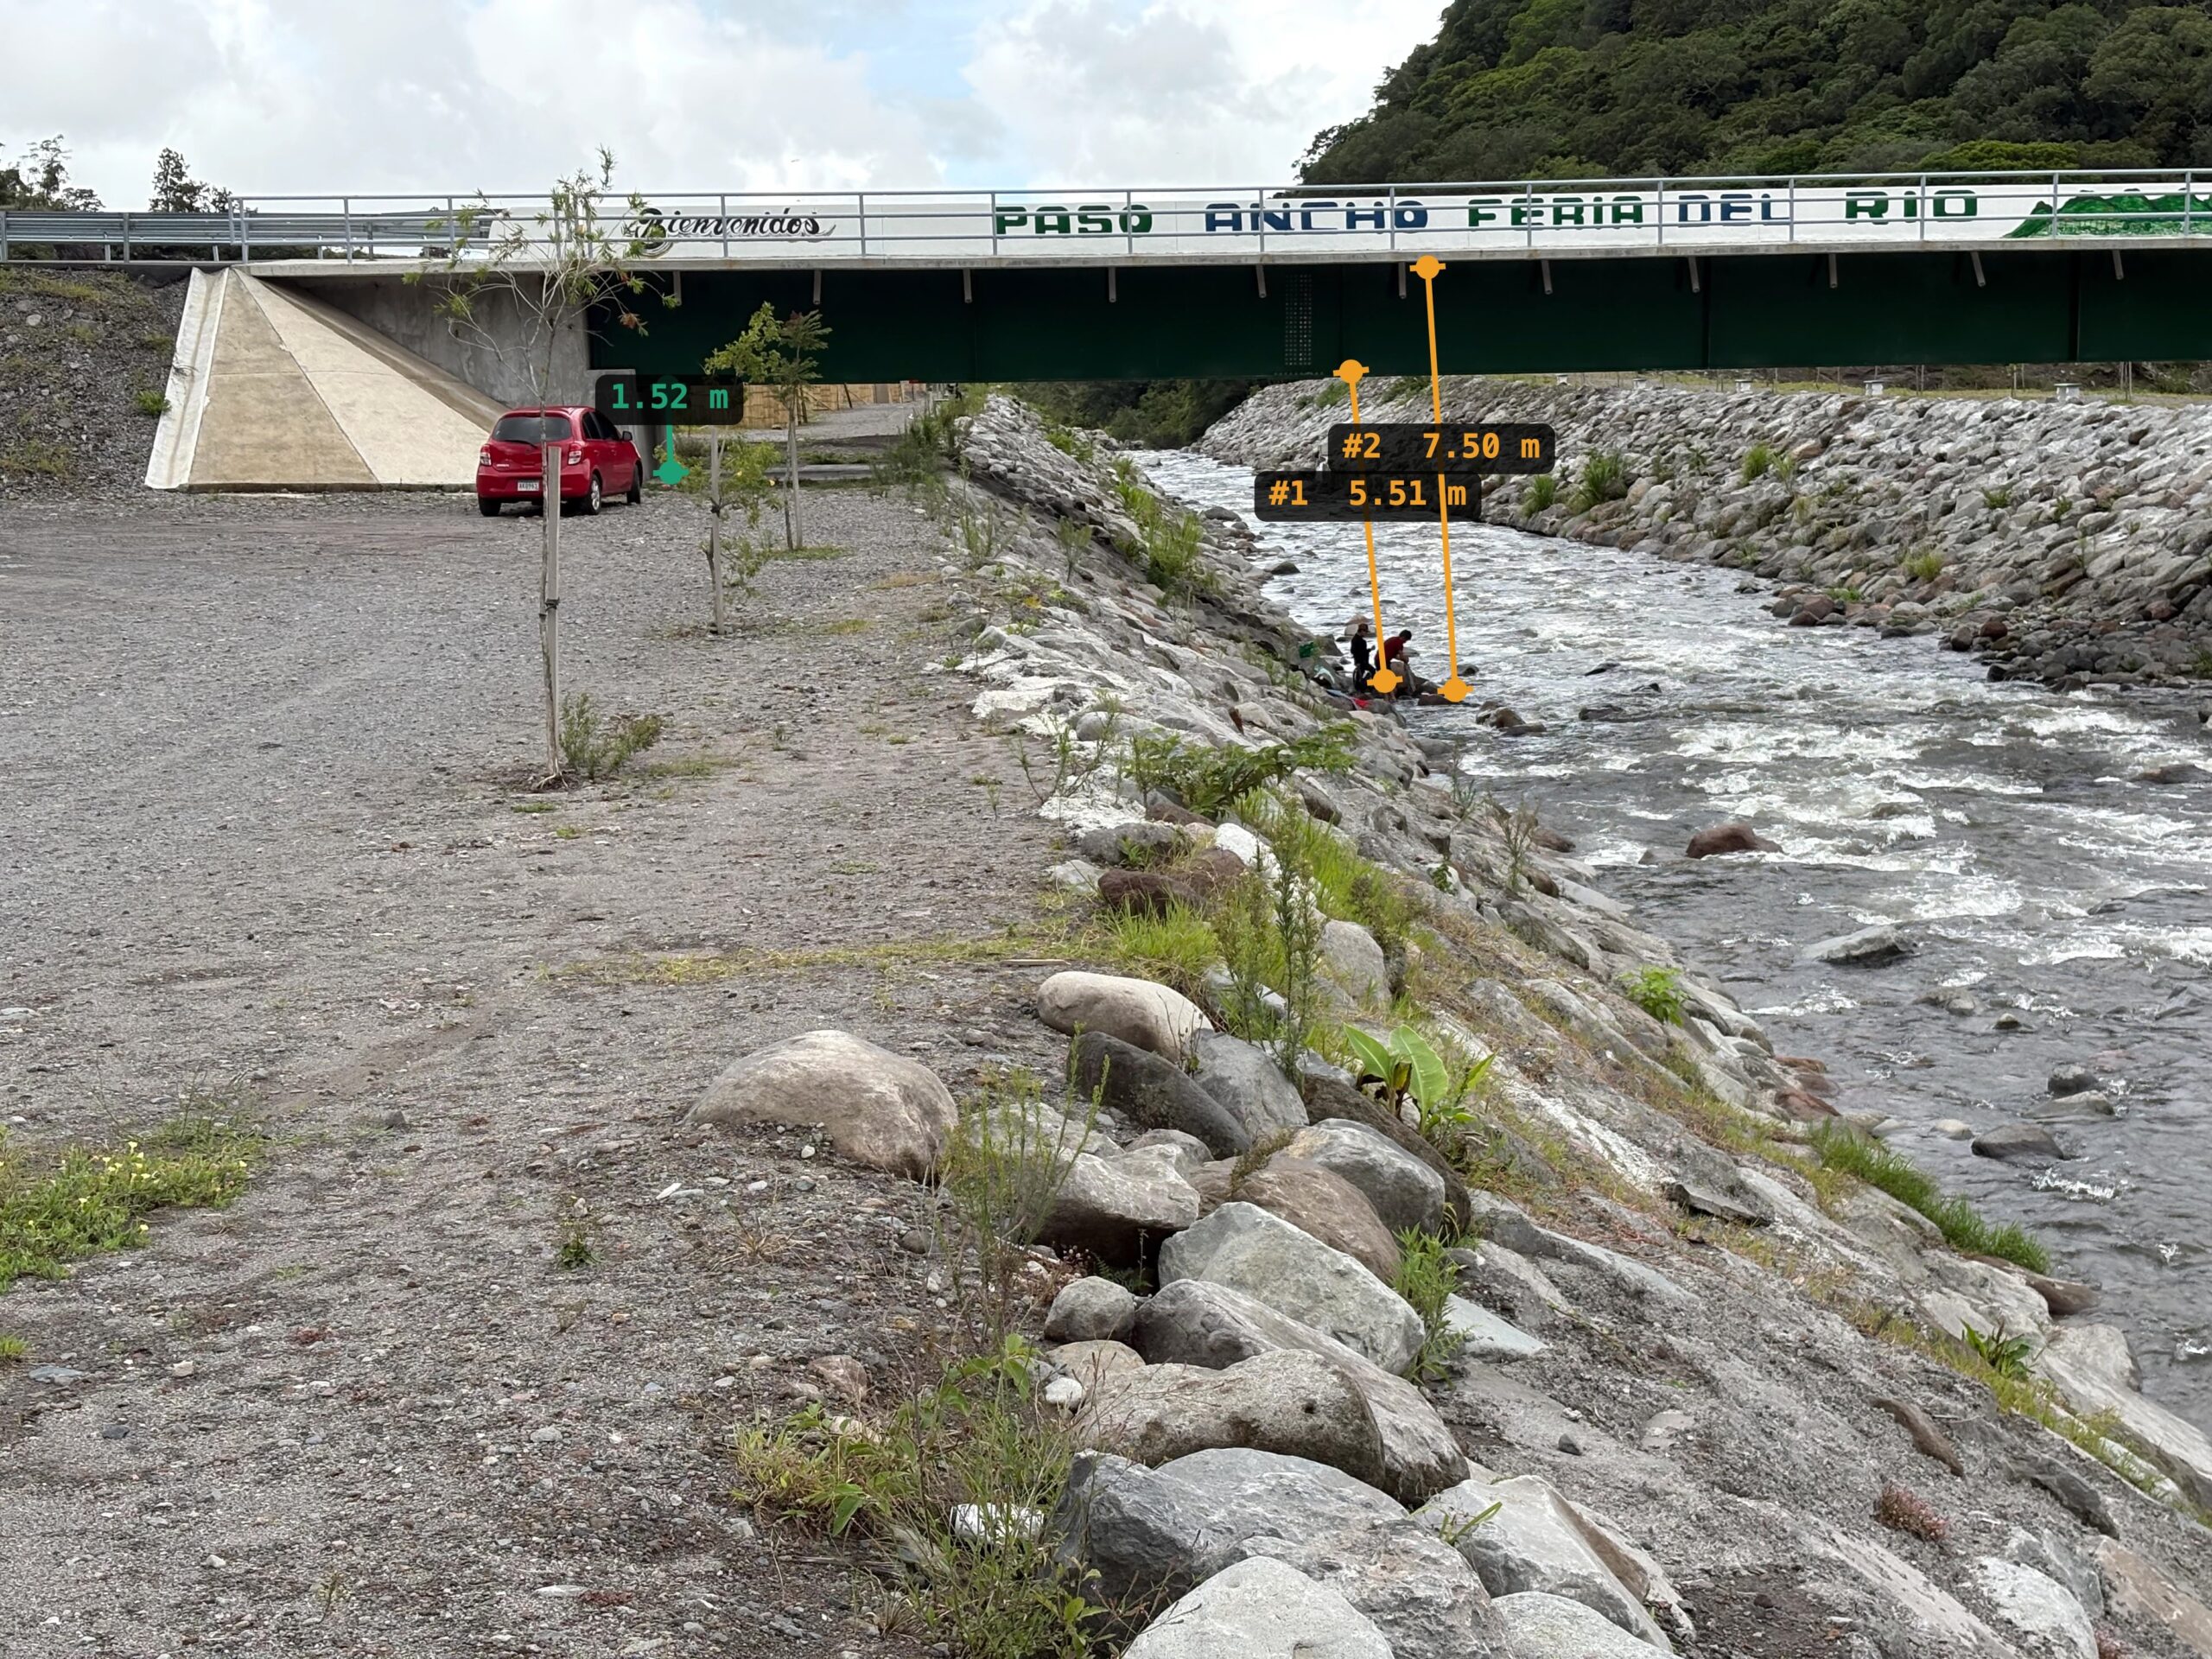 There is a roughly 6-meter-high clearance at normal flow between the bottom of the bridge and the surface of the water. That means flash floods can rush underneath without logs and debris bottlenecking the structure.
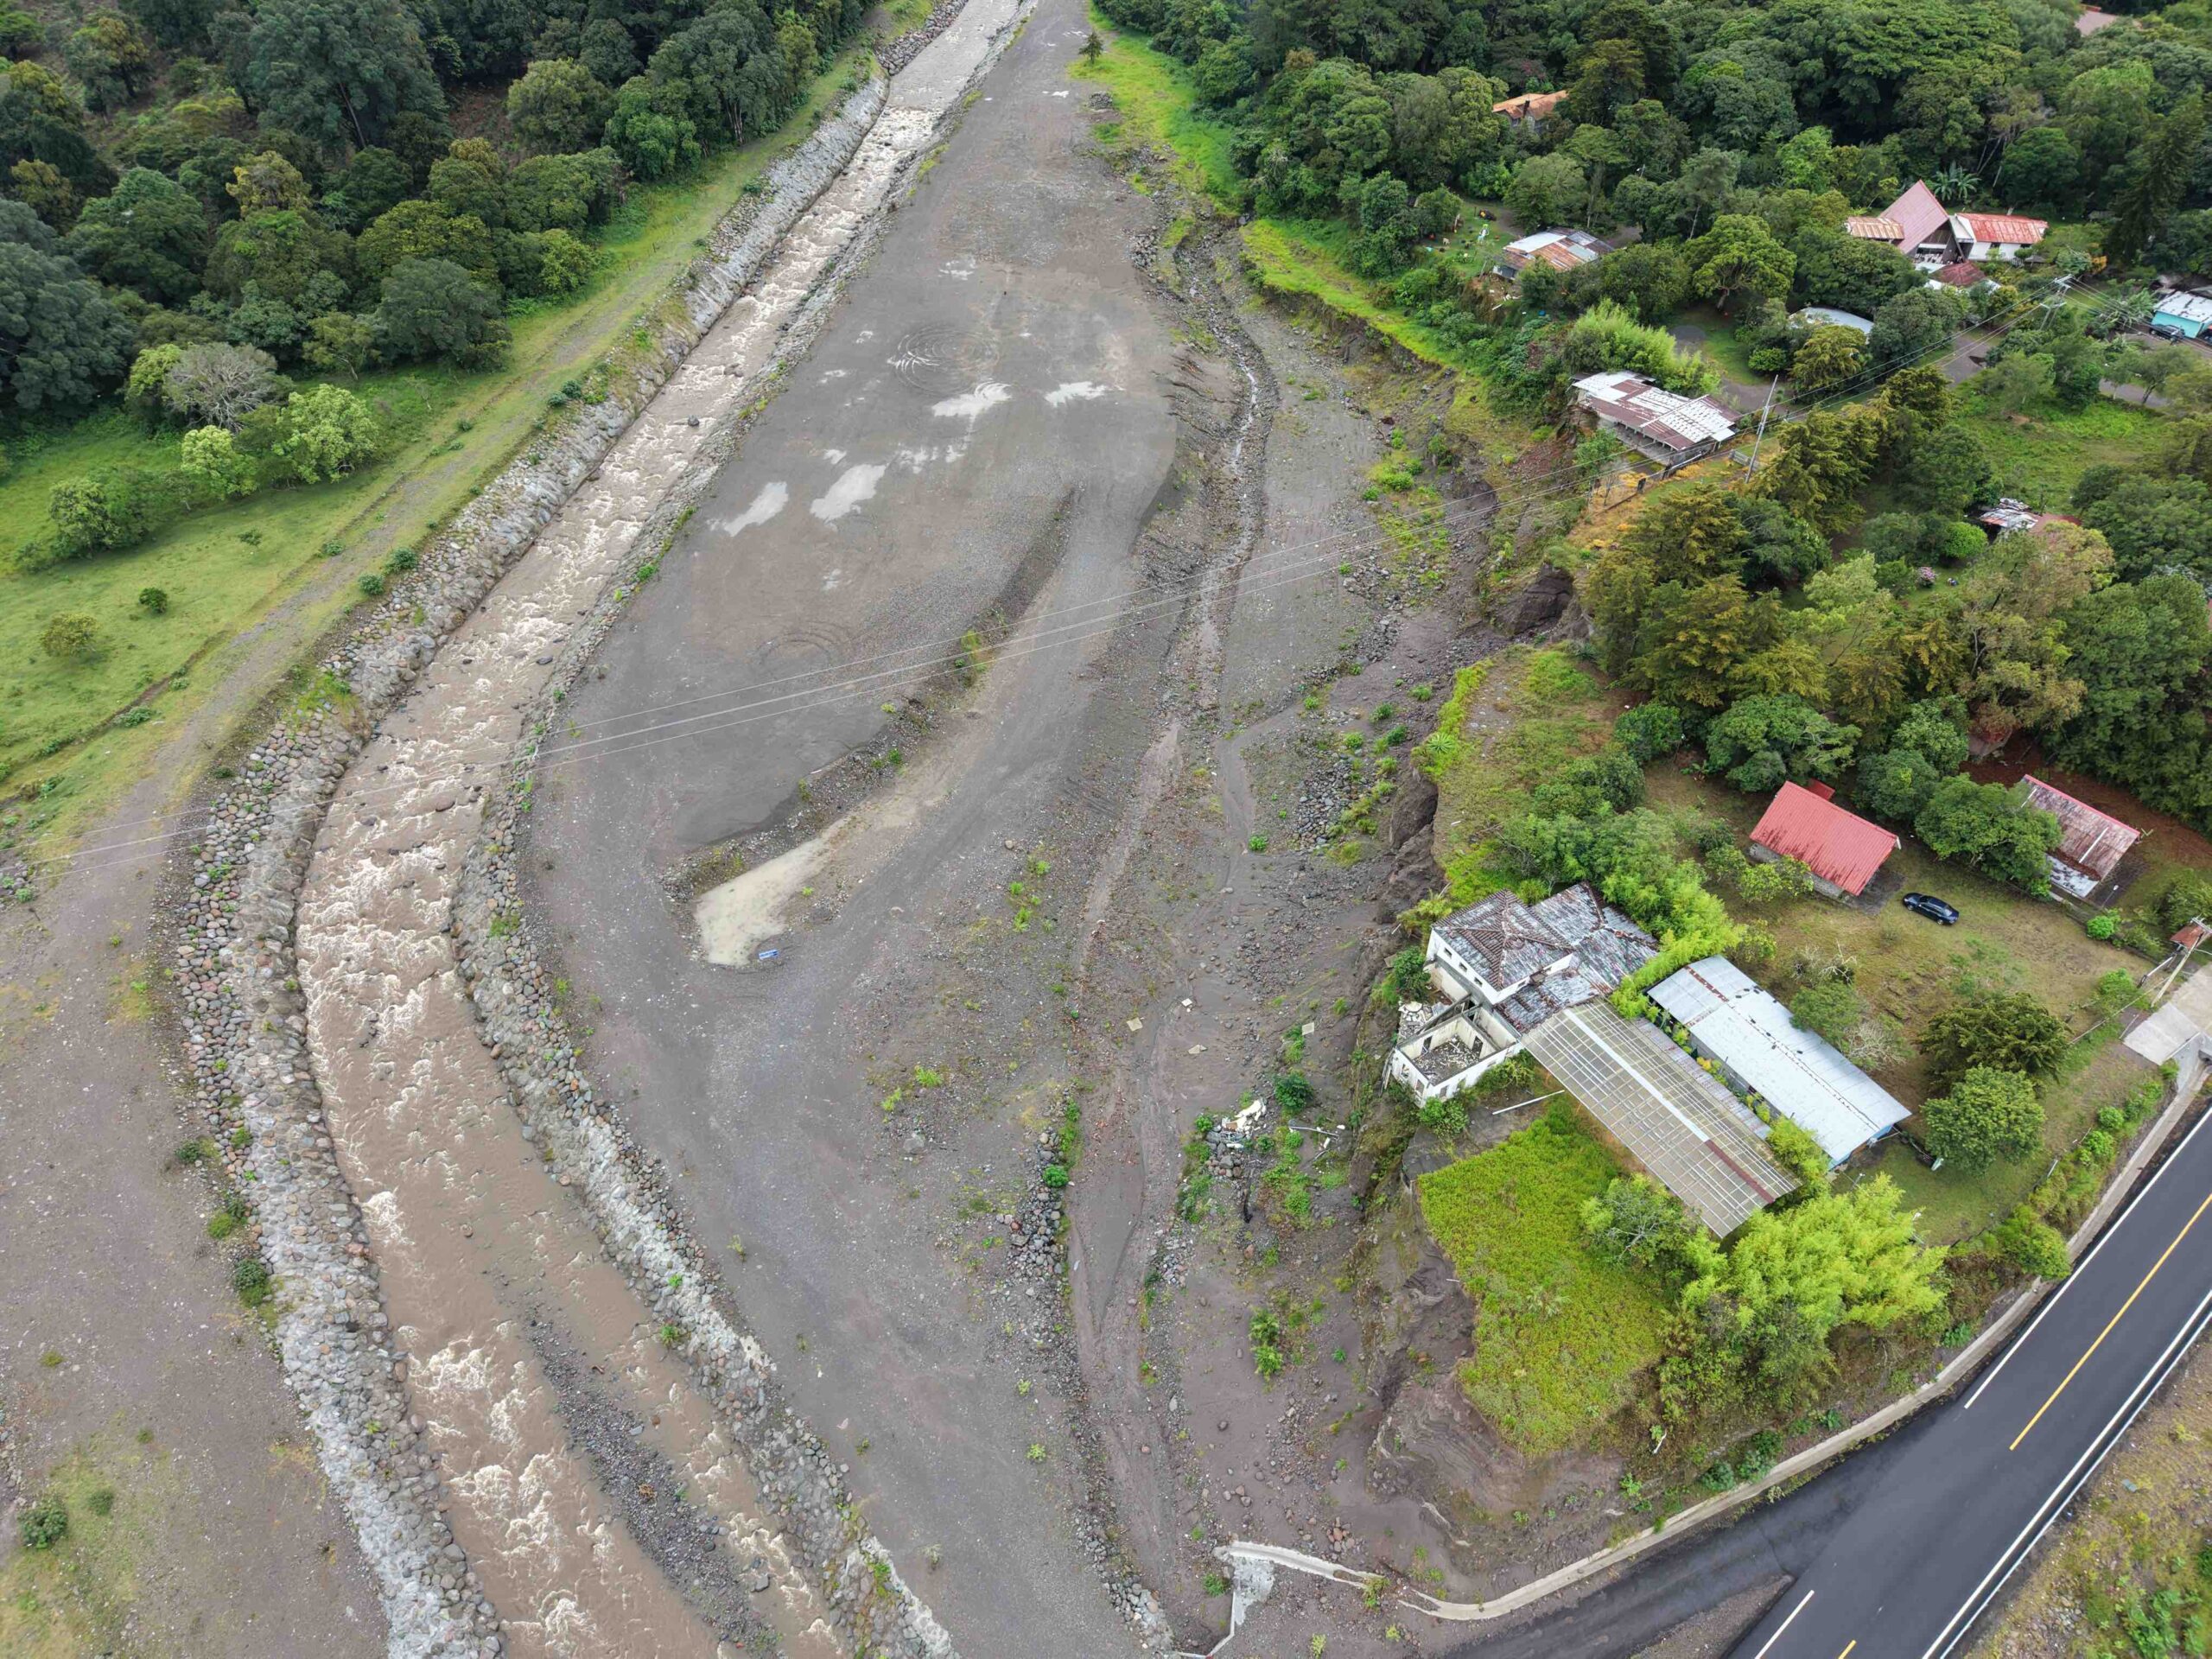 The top-center of the photo shows a huge ridge of compacted earth and stone built to cut off the secondary channel and isolate the 72-foot cliff from standard river flows. The dark, damp line along the base of the cliff currently acts as a collector for hillside and upland runoff, feeding it down toward a 5-foot concrete pipe.
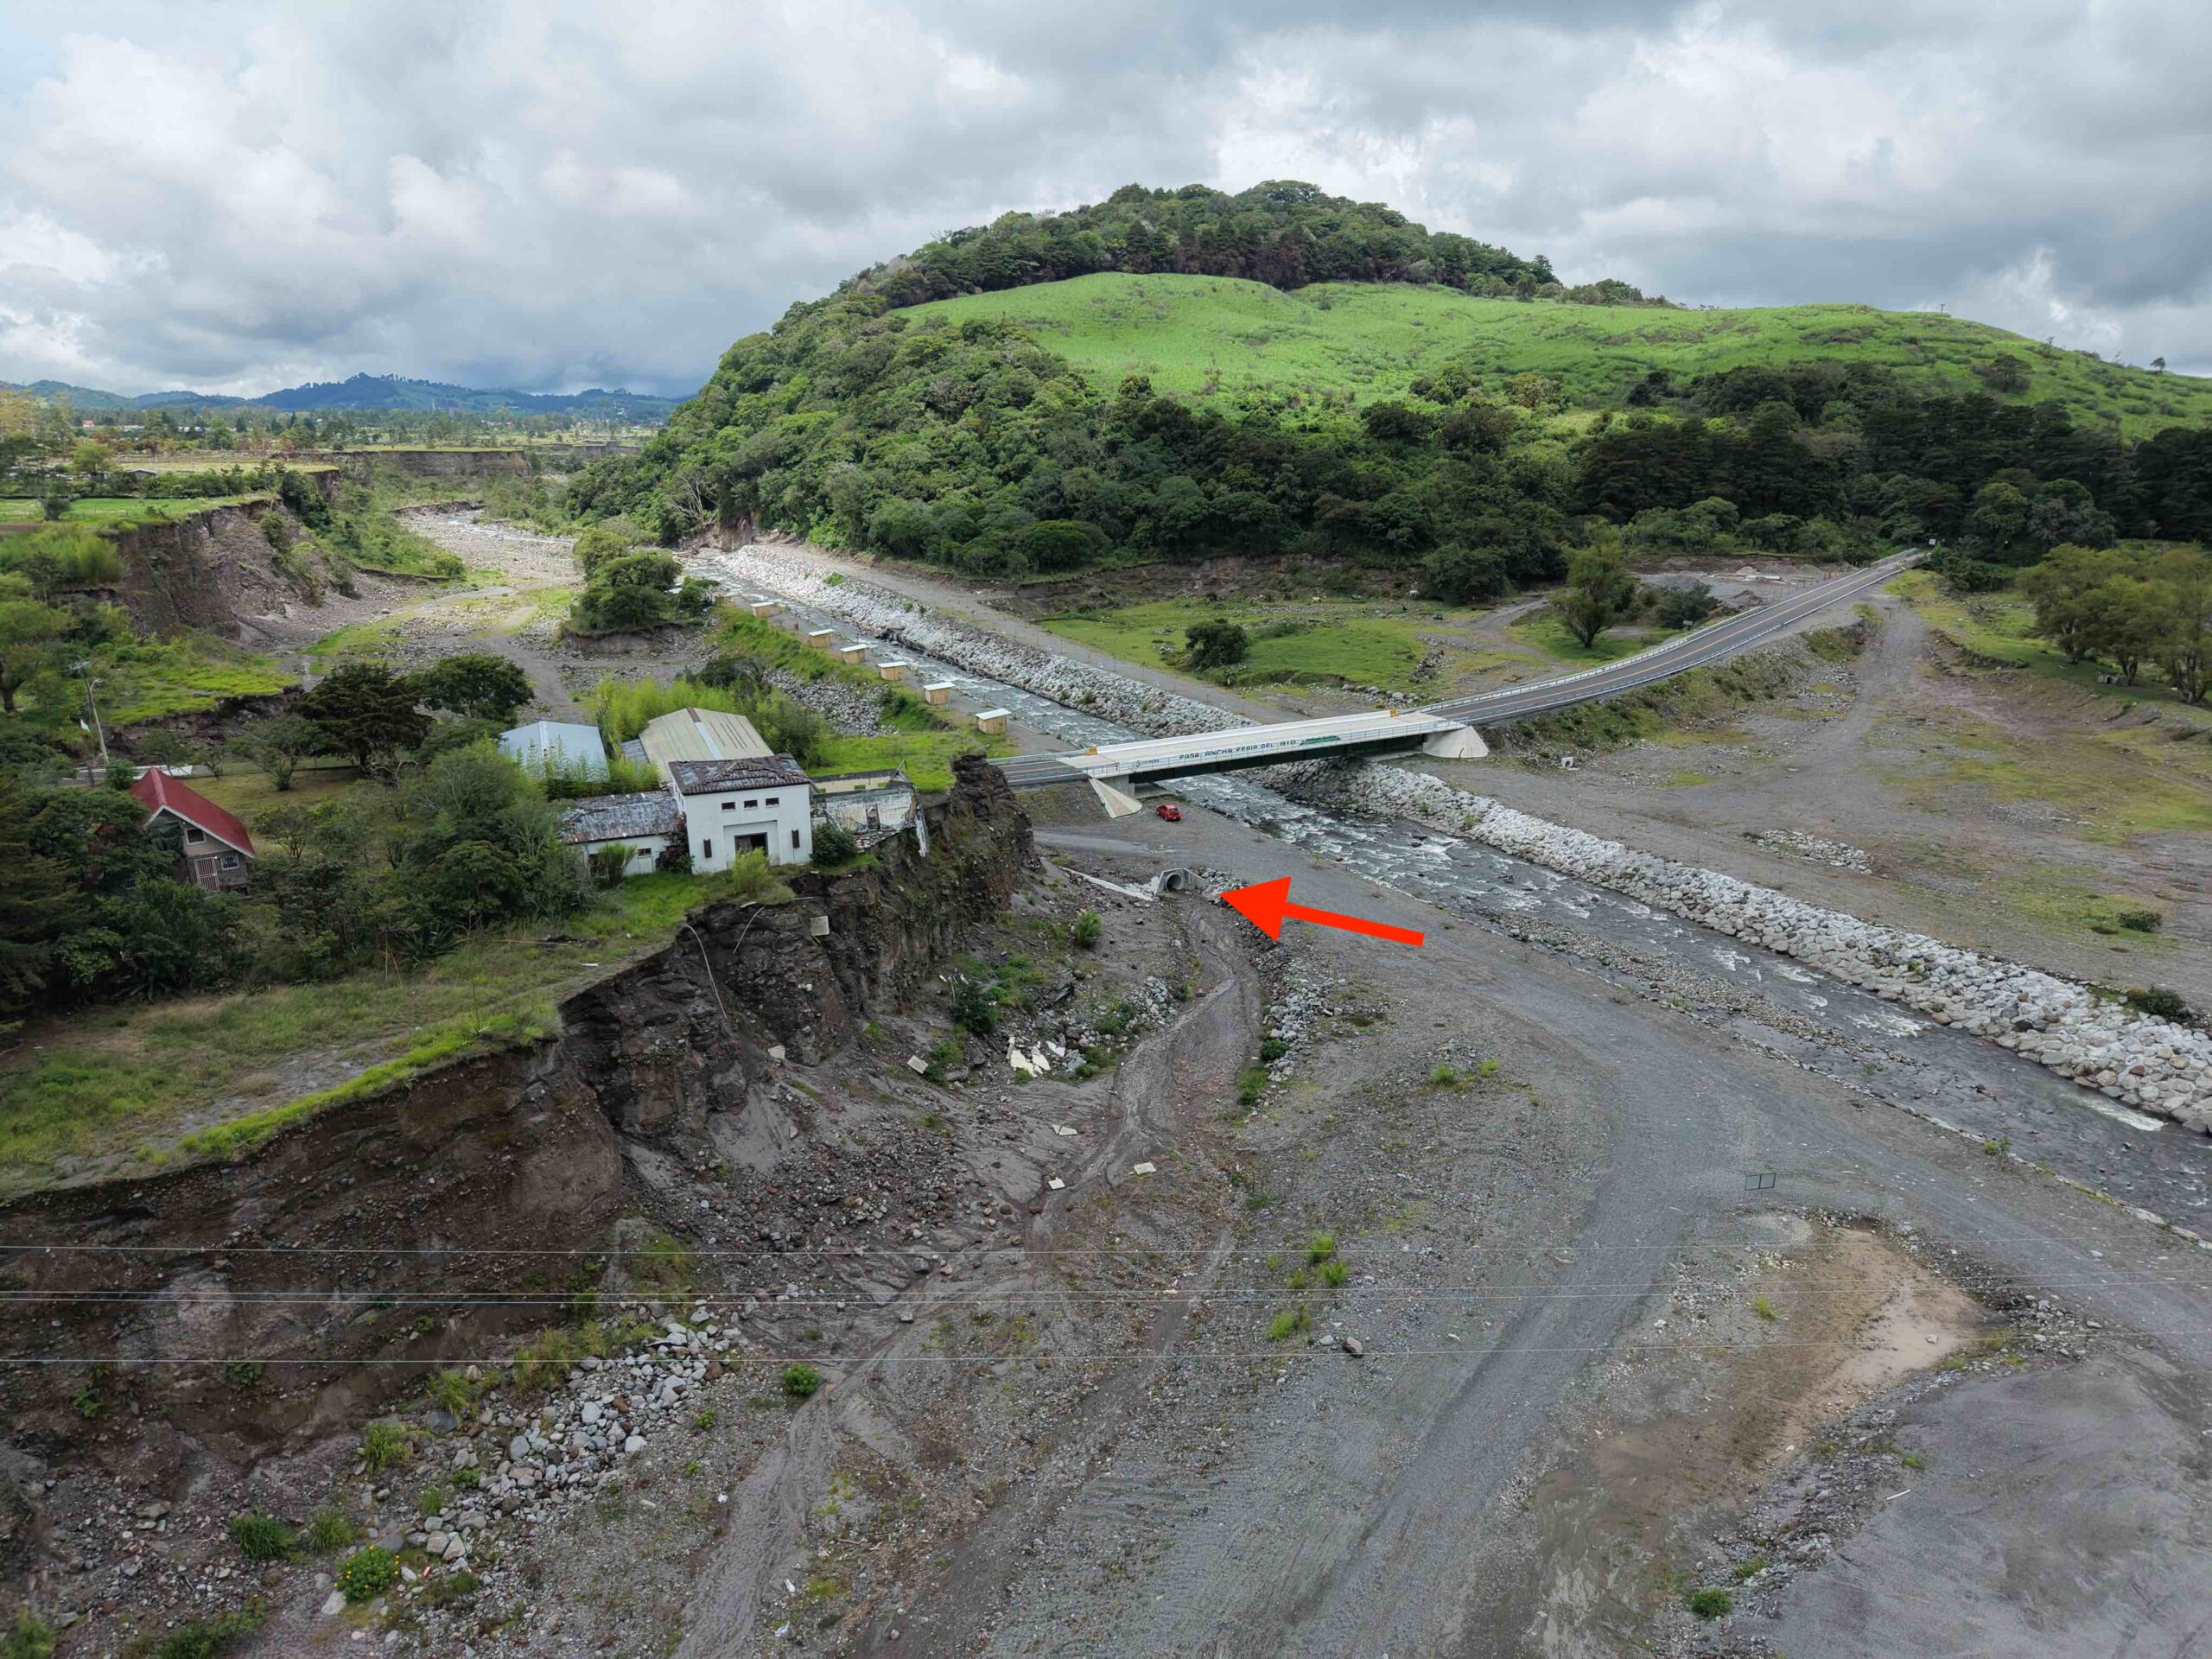 The red arrow points to the concrete pipe.
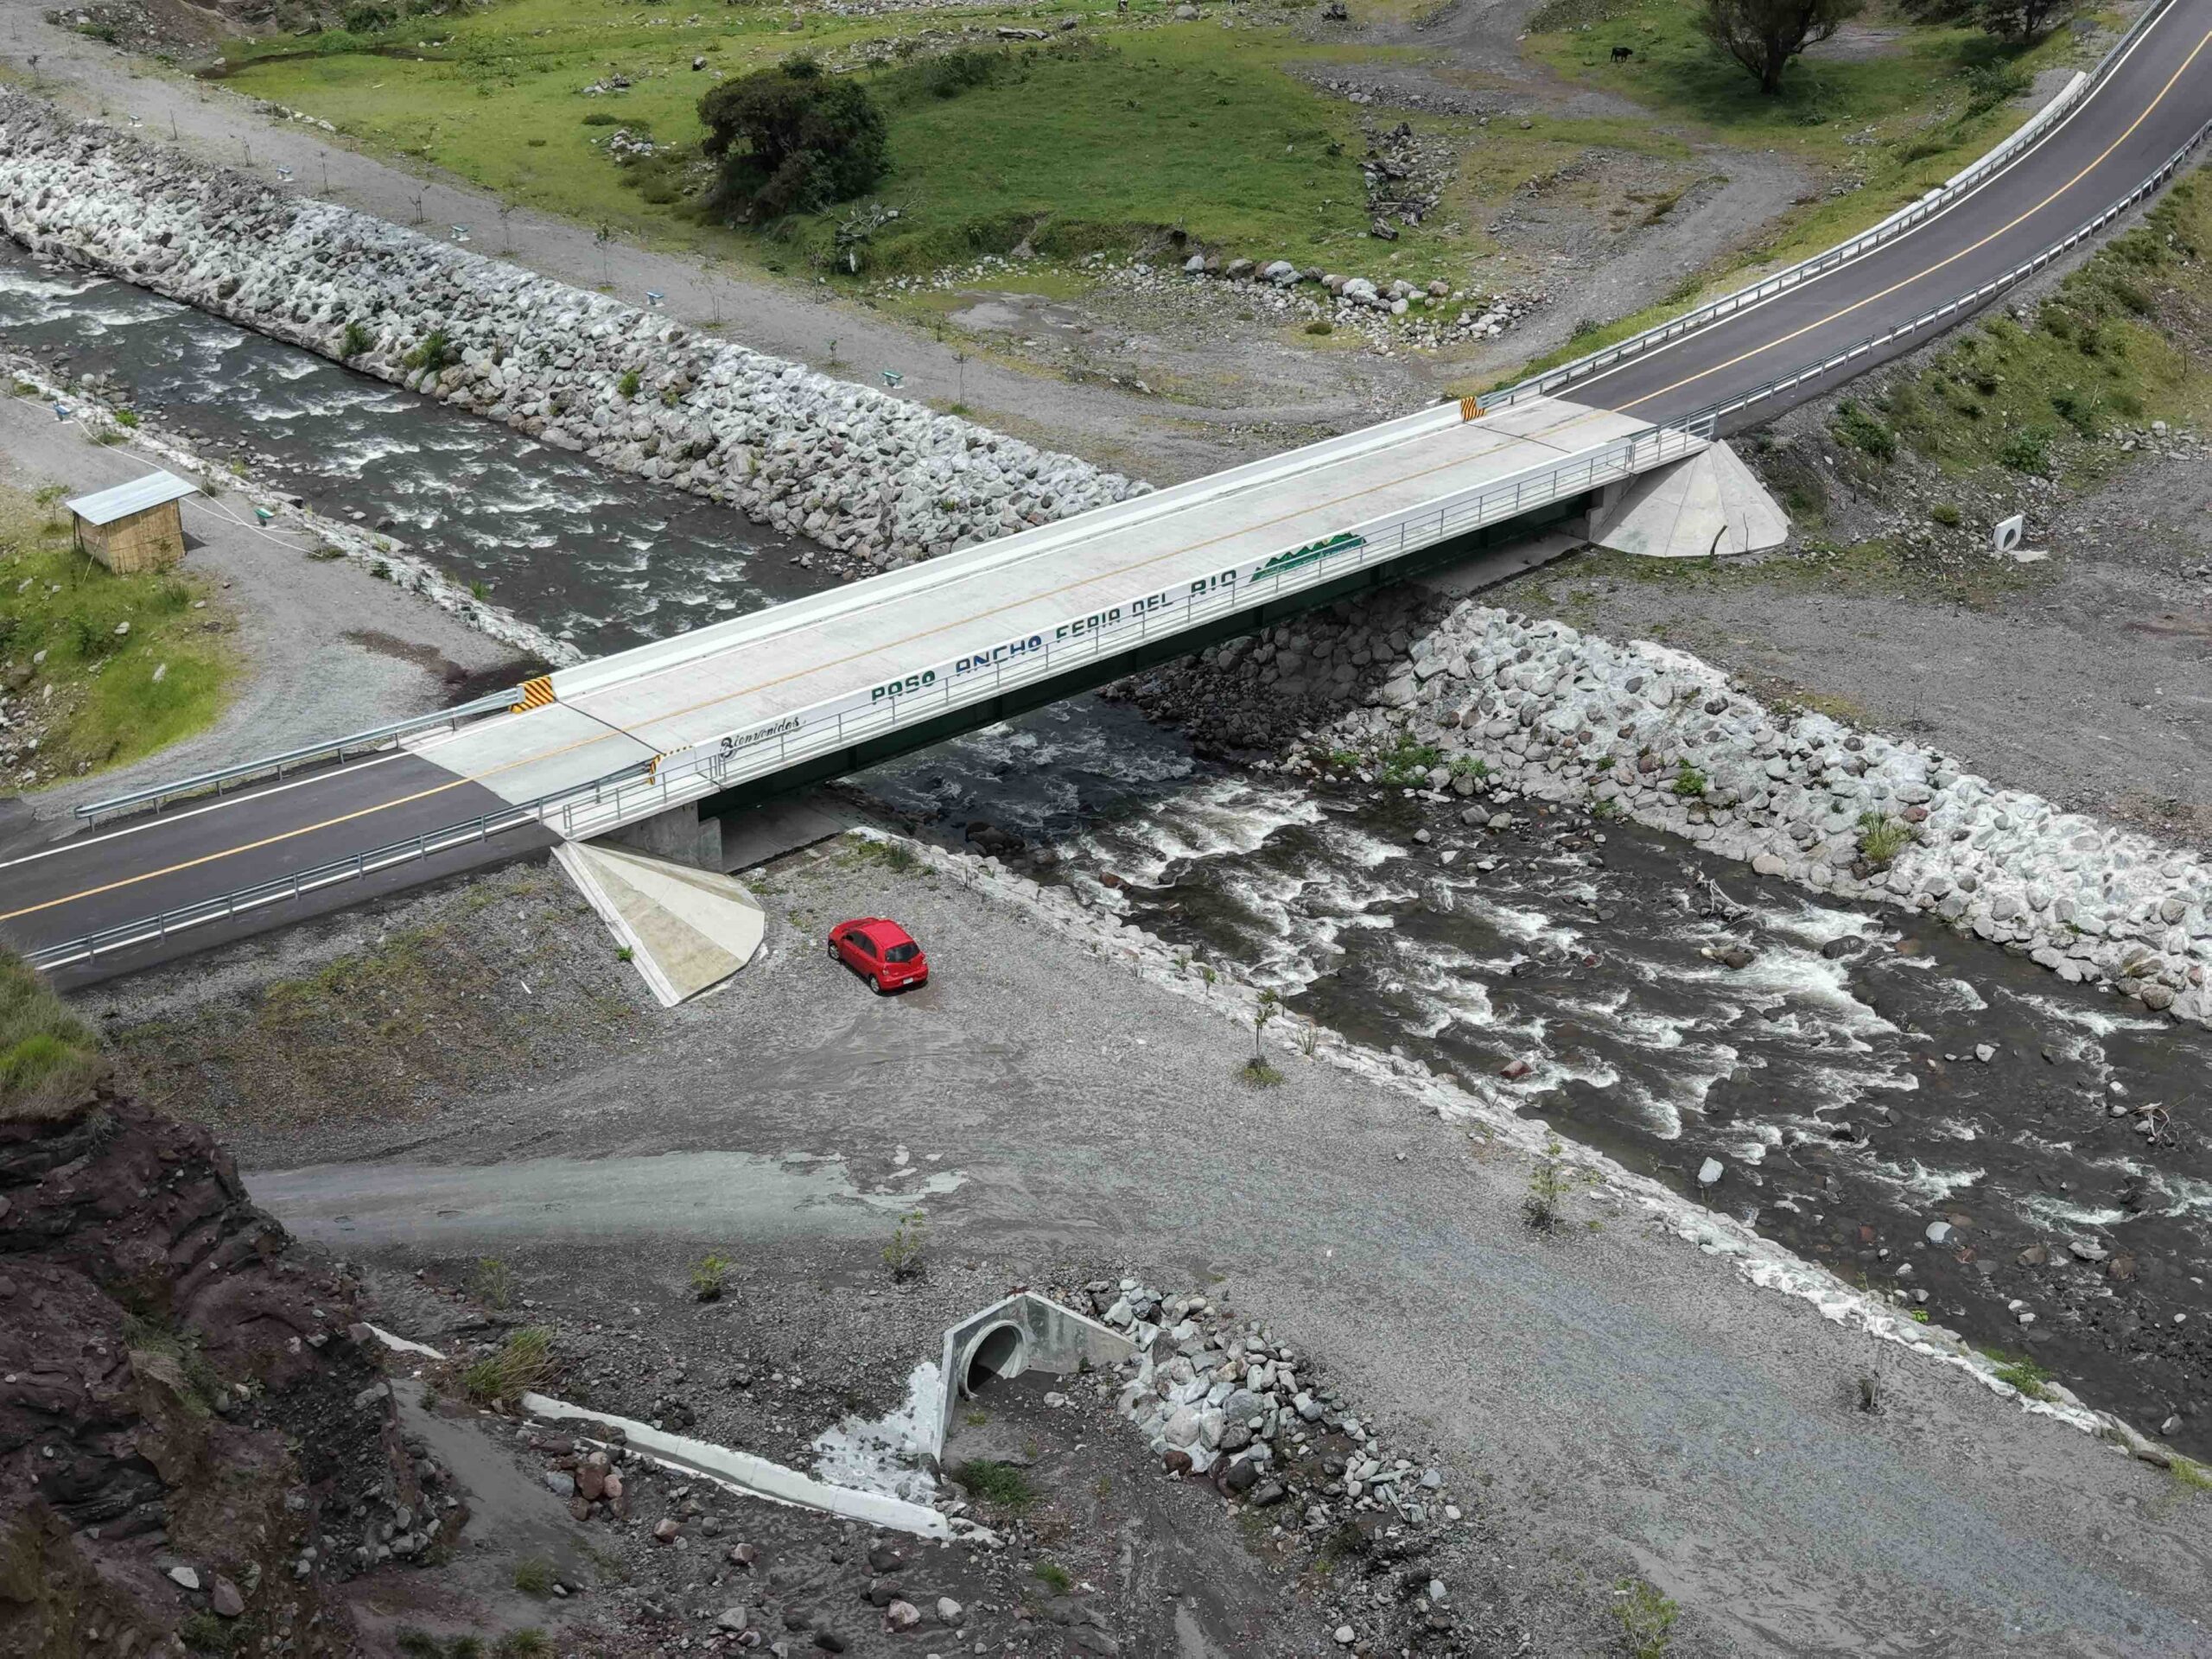 The bridge itself is built robustly with steel and a solid concrete slab, but it faces a risk of localized washouts along its unarmored left approach ramp, according to Gemini.
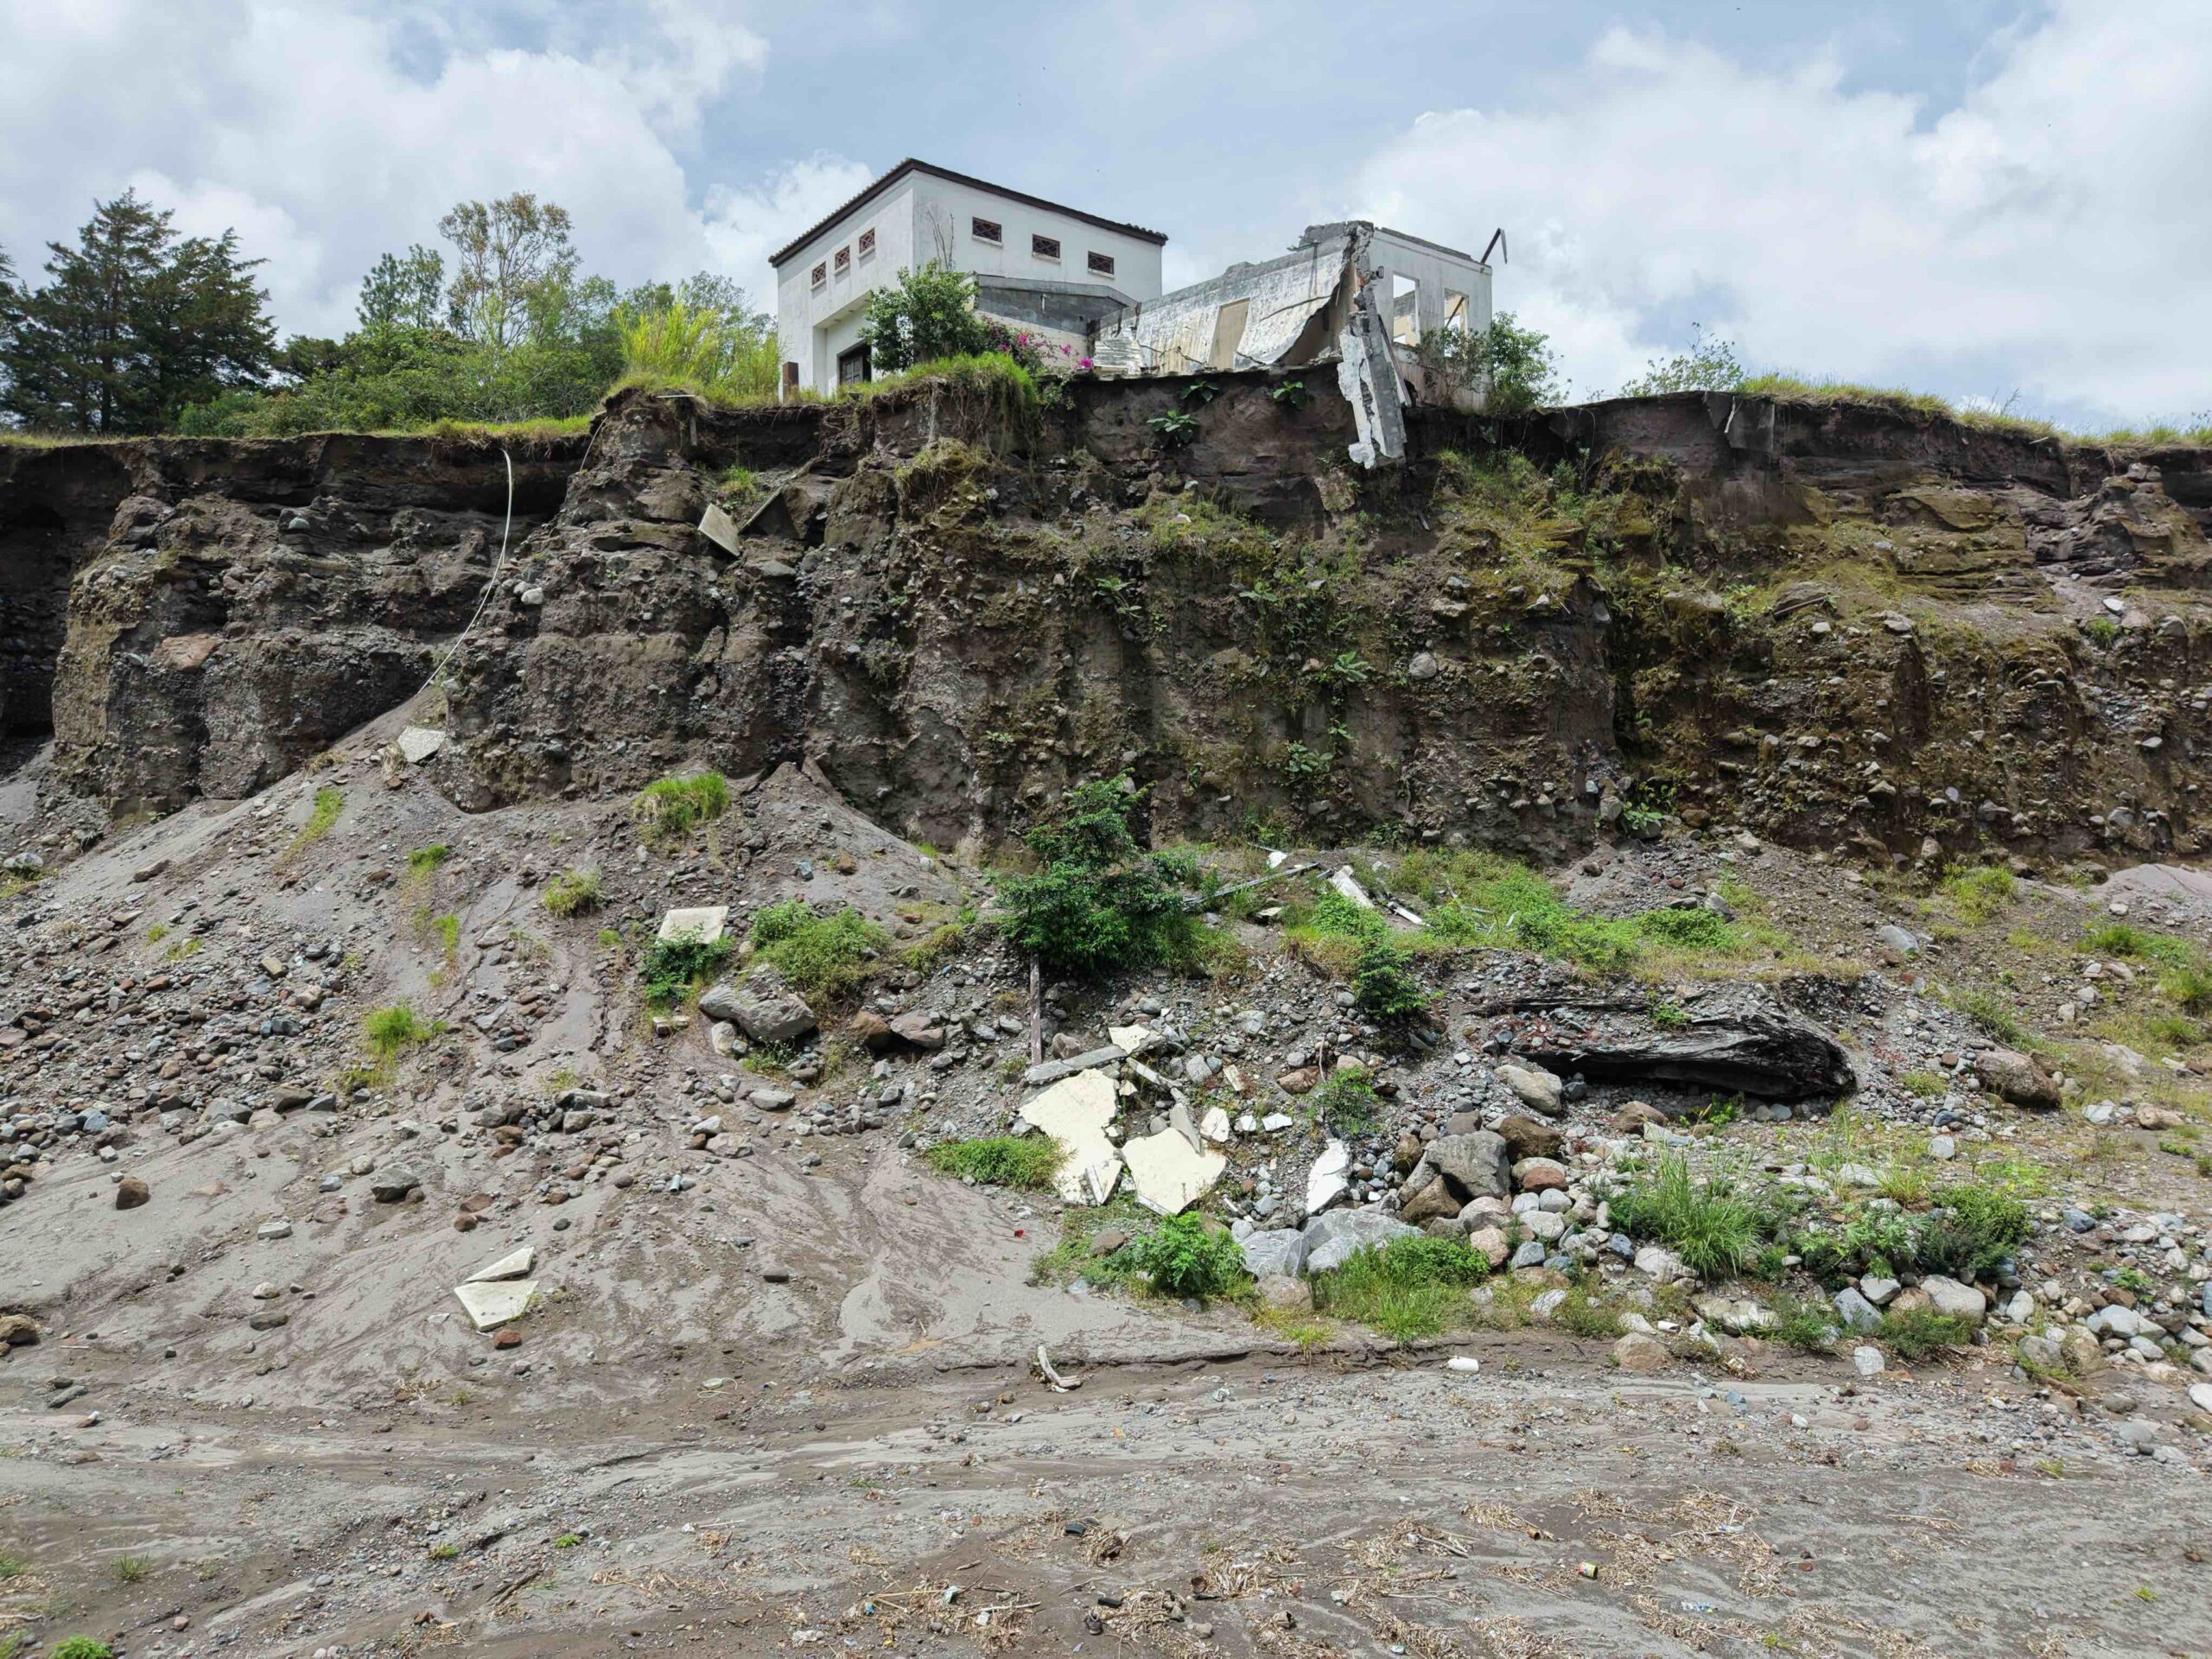
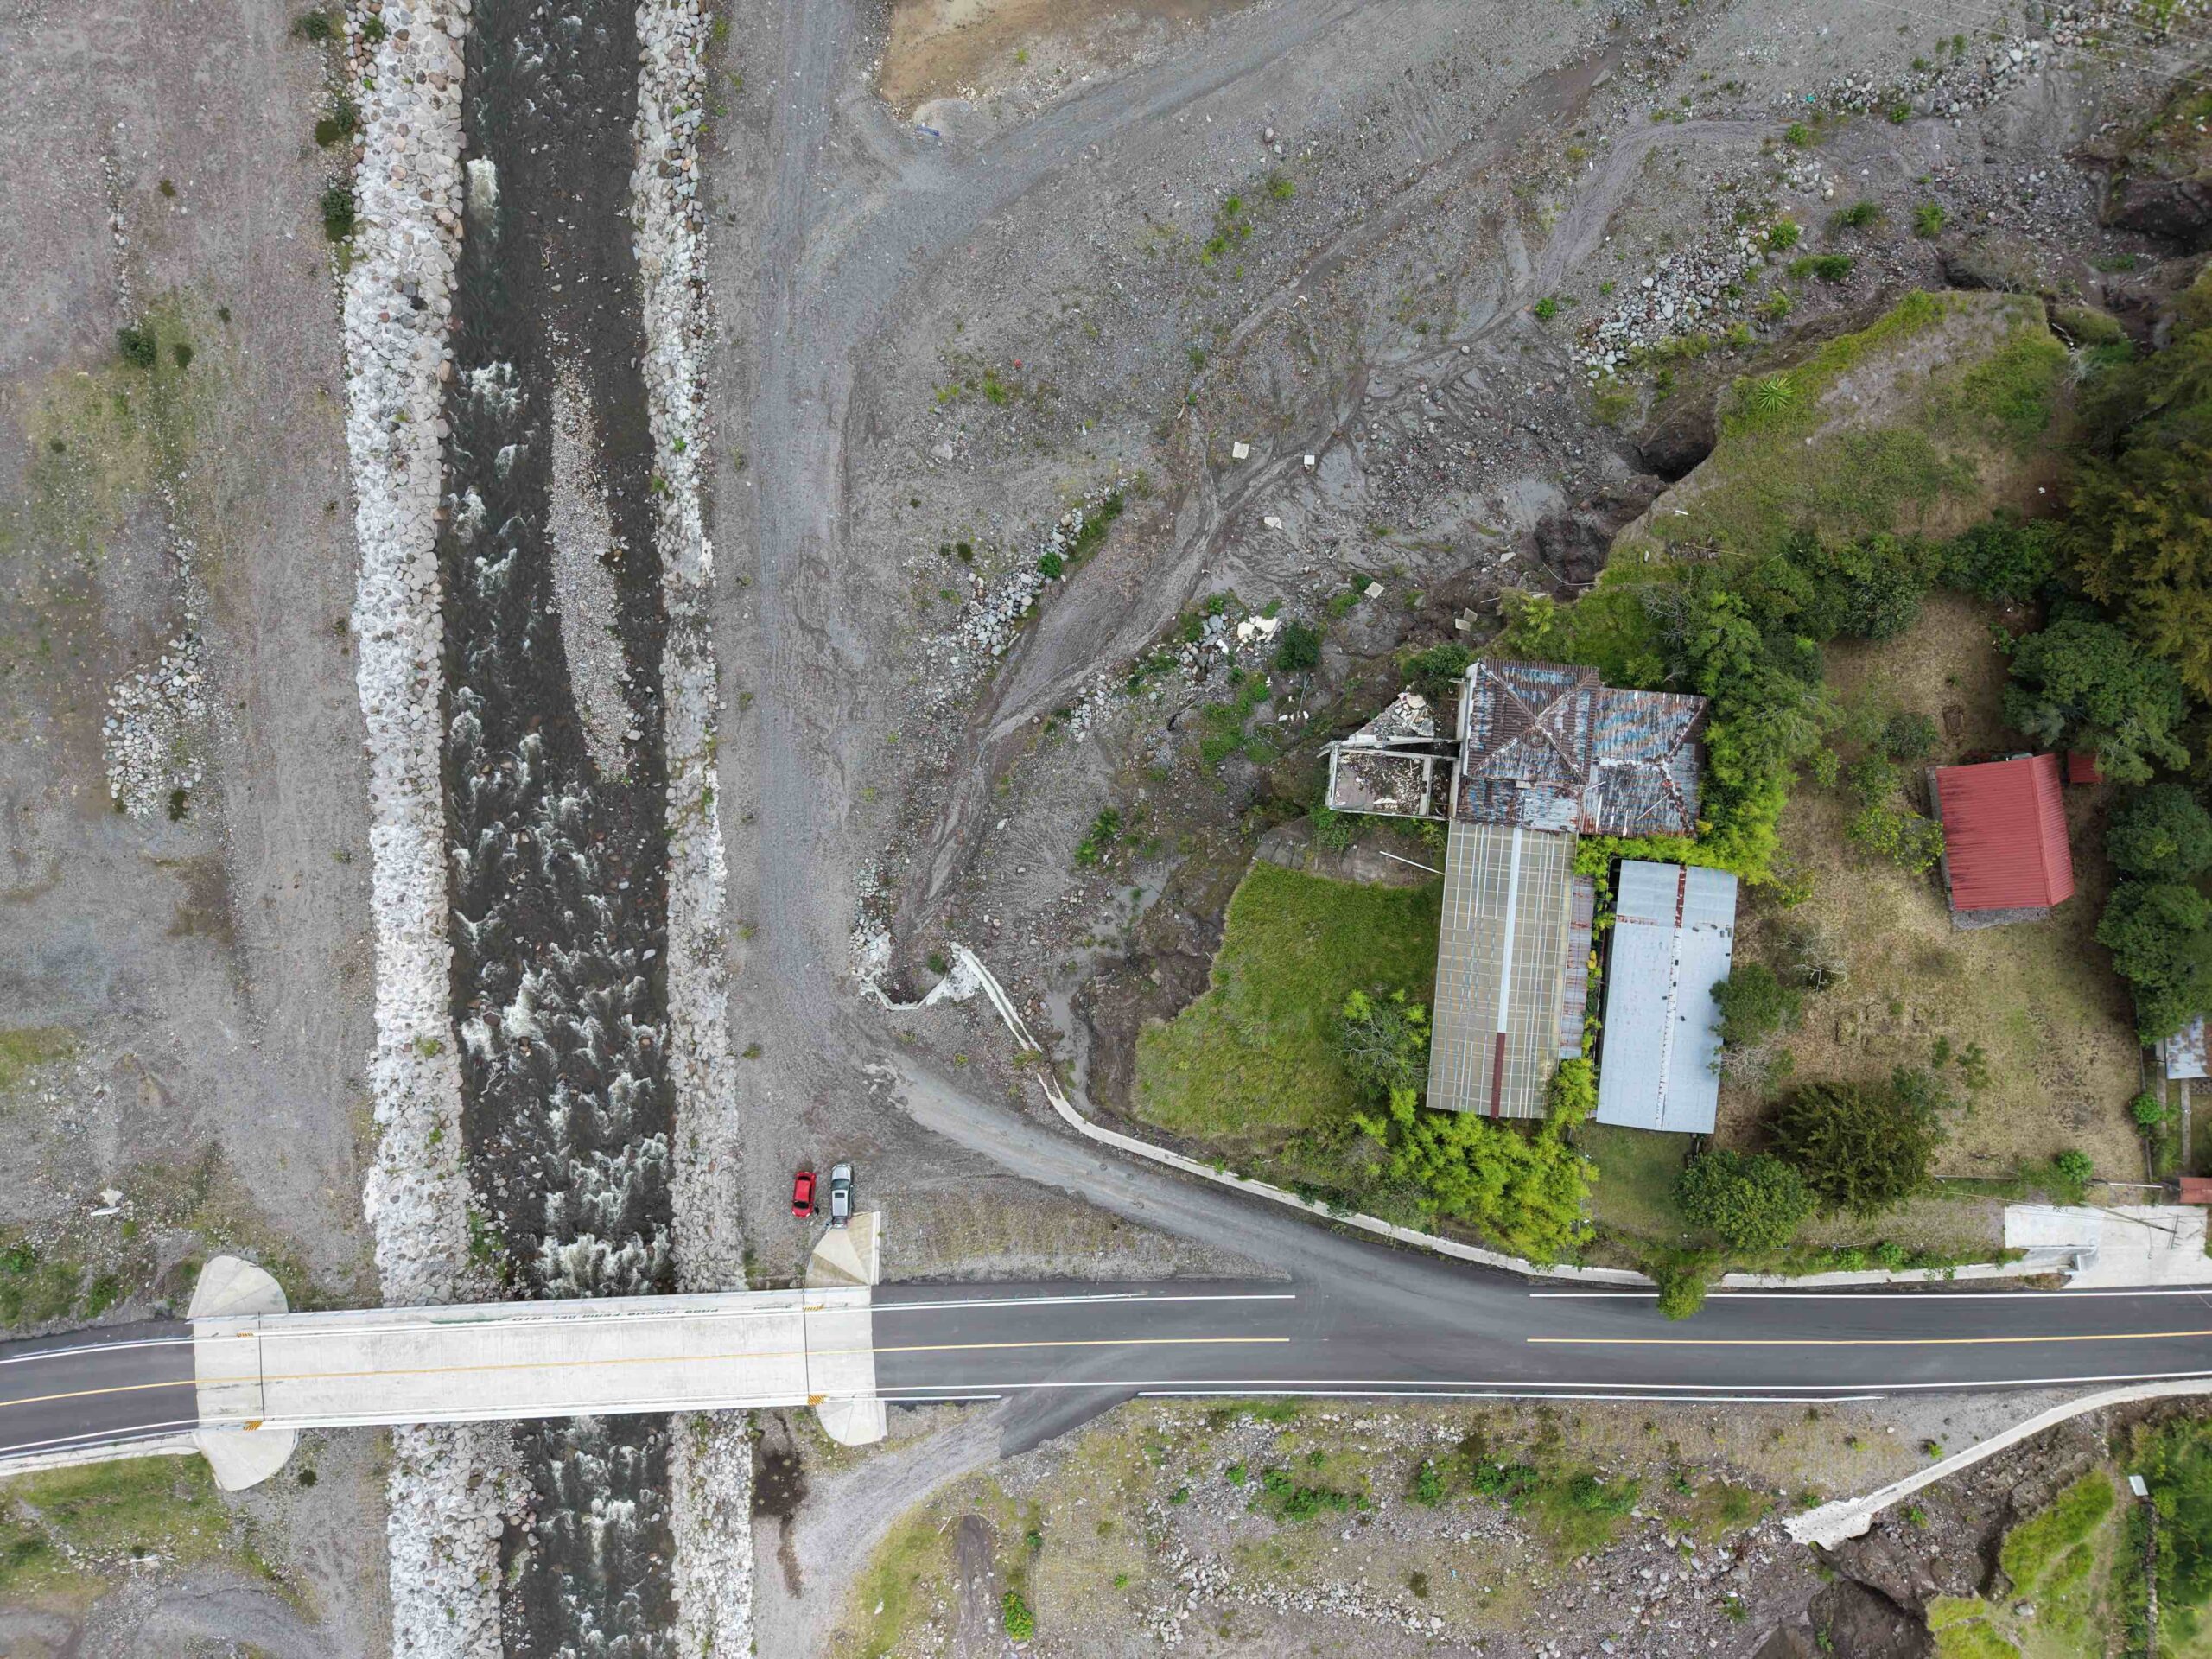 This image emphasizes why the white house remains in peril even if river water never reaches it. Torrential downpours during a Hurricane Eta-magnitude event could engulf the volcanic plateau above the house. This water runs independently of the river, pouring straight down into the large subterranean cave-in void behind the house, liquefying the loose soil from the inside out.
Gemini’s Safety Scorecard
- Right Bank & 45-Degree Turn: 100% Secure. Protected against erosion, undercutting, and structural failure across all scenarios.
- Bridge Superstructure: 95% Secure. The heavy concrete slab and steel frame will easily withstand the high-velocity flume water passing beneath and over it.
- Left Bridge Approach Ramp: Critical Vulnerability. Facing a high risk of being washed out and isolated during a 50-year or historical storm due to receiving the entirety of the redirected left-side breakout flow.
- The 72-Foot Cliff Face & White House: High Geotechnical Risk. Safe from direct, high-velocity river pounding, but actively vulnerable to internal collapse triggered by heavy top-down rainfall runoff saturating the loose volcanic soil crater.
Weaknesses in this analysis, according to Gemini, include the lack of:
- Soil samples needed for improved risk analysis.
- High-resolution topographic surveying.
- Structural blueprints showing how deep the bridge’s concrete foundations go or whether they are anchored into solid bedrock or loose river gravel.
Getting insights from engineers, experts and people who worked on the project would improve the analysis further. But this analysis is much better than my first one, “Predicting the Unpredictable: An AI-Assisted Look at the Chiriquí Viejo River’s Future.”
A few days after publishing that first article, I got to thinking that some of the conclusions made no sense. So I tore apart that first version and redid everything. I dug into why AI came up with its conclusions. I discovered reasons why my first article was so flawed.
- In the first analysis, I didn’t account for the full height and width of the river banks. That’s important because it gives the river room to expand without overflowing its banks. I took more complete measurements to try to correct that flaw.
- I didn’t pay enough attention to safeguards aimed at preventing the next big flood. These include Bagatrac’s 30,000 m³ engineered berm and 2,800 m³ of concrete mortar to bolster the riprap armor along the river.
- I published the first article without fully understanding how Gemini reached its conclusions. I put too much faith in AI.
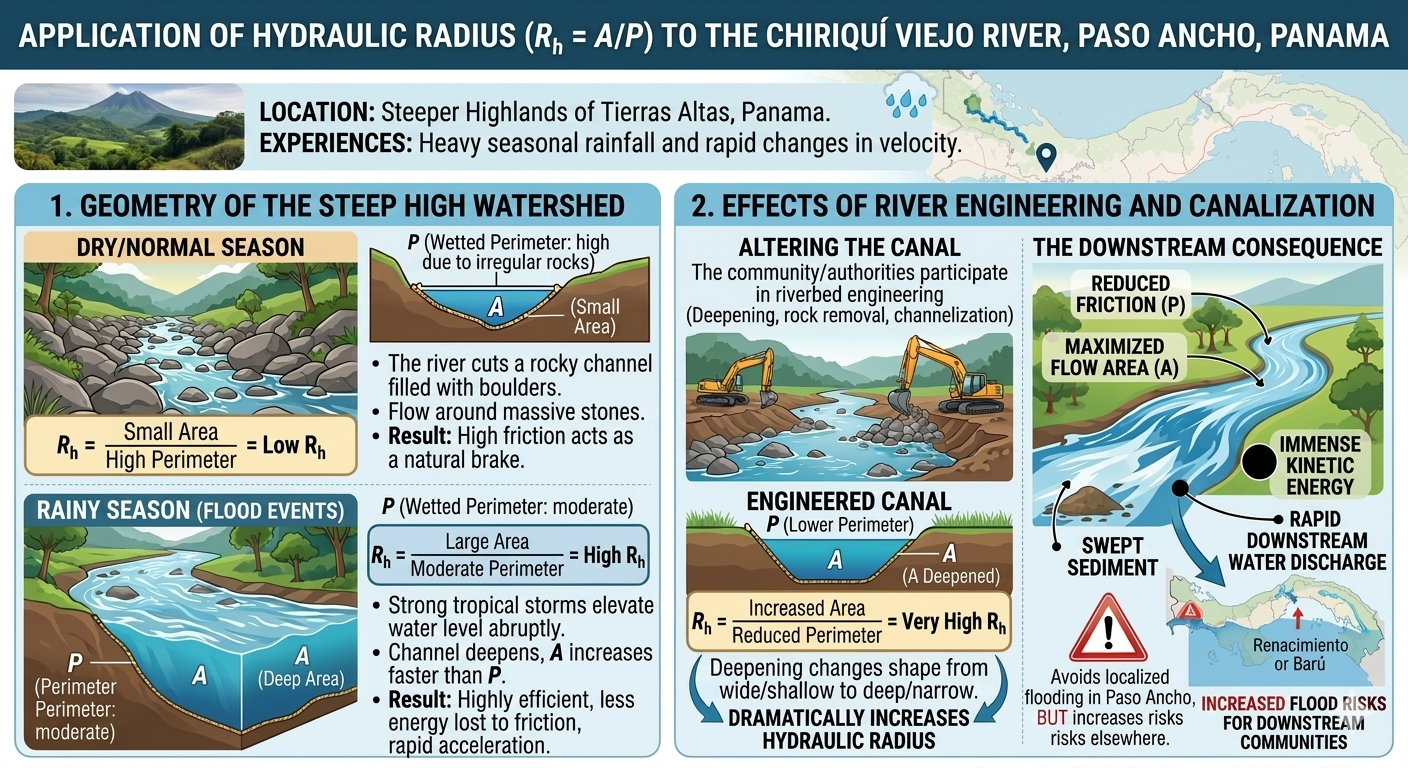
- In the SINAPROC report, the author writes that the “hydraulic radius corresponds to approximately 80% of the channel.” Gemini took that to mean there’s only a 20% safety margin before the river overflows the banks. But all you need to do is walk along the river and you can see that flowing water – absent torrential rain – takes up perhaps 15% to 30% of the river channel along the 800-meter stretch. So I asked Gemini to omit that reference from this analysis. (See graphic below if you’d like to learn more about hydraulic radius.).
 This time around, I interrogated AI more aggressively and took more time to examine and evaluate Gemini’s sources.
Of course, this analysis is no substitute for a professional study. But it’s a way for an old-fashioned journalist like me to keep busy.
I’ll continue updating and adding information here as I learn.
2 thoughts on “Better data softens Chiriquí Viejo forecast, but an Eta-level storm still spells peril”